


NVIDIA says its BlueField-2 smartNIC/DPU can link a storage system to a server and run four times as fast as Fungible’s competing hardware and software. But it did not reveal details of its test, making for confusion and incomplete understanding – until detailed tables were supplied, showing an awesome 55 million IOPS number – possibly served from a DRAM cache.
Update 1: NVIDIA BlueField-2 NVMe/TCP and NVMe RoCE detailed numbers tables added. 21 Dec 2021. More Fungible test details added as well.
Update 2: NVIDIA served the data blocks from the storage targets DRAM making this a networking test and not a storage test. It is not directly comparable with Fungible at all. 21 Dec 2021.
NVIDIA’s headline claim, in a blog, by Ami Badani, VP Marketing and DevRel Ecosystem, is that its BlueField-2 data processing unit (DPU) more than quadruples the previous record holder by exceeding 41 million IOPS between server and storage.
But the blog does not reveal the data transport protocol, the data block size nor whether it was for read or write operations – meaning we cannot assess real world relevance at all until the missing details are revealed.
The blog cites these performance numbers using BlueField-2:
- >5 million 4KB IOPS with NVMe/TCP
- 7 million to 20 million 512B IOPS with NVMe/TCP with the variation unexplained
- 41.5 million IOPS with unspecified block size and transport; presumably RoCE
It says NVMe/RocE (RDMA over Converged Ethernet) is faster than NVMe/TCP, but no numbers are cited to justify this.
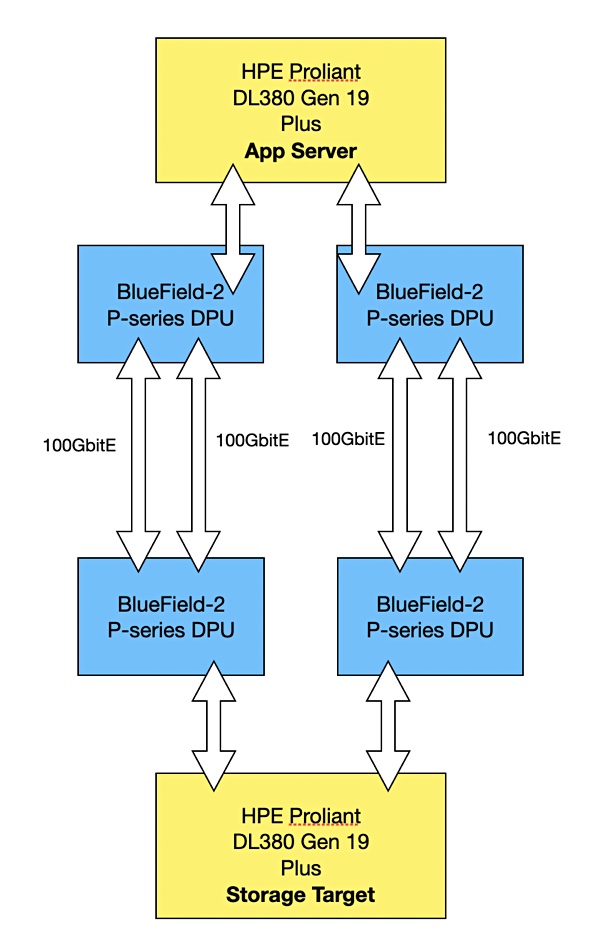
The blog describes the testing methodology and configuration (see diagram above). It says there were two HPE Proliant DL380 Gen 10 Plus servers, one as the application server (storage initiator) and one as the storage system (storage target). Each server had two Intel “Ice Lake” Xeon Platinum 8380 CPUs clocked at 2.3GHz, giving 160 hyperthreaded cores per server, along with 512GB of DRAM, 220MB of L2/L3 cache (110MB) per socket) and a PCIe Gen4 bus.
We are also told for example that the initiator and target systems were connected with “NVIDIA LinkX 100GbE Direct-Attach Copper (DAC) passive cables.” Wonderful.
We are informed that: “Three different storage initiators were benchmarked: SPDK, the standard kernel storage initiator, and the FIO plugin for SPDK. Workload generation and measurements were run with FIO and SPDK. I/O sizes were tested using 4KB and 512B, which are common medium and small storage I/O sizes, respectively.”
But the cited performance numbers are not connected to SPDK, the standard kernel storage initiator, or the FIO plugin. The storage initiator ran either a default Linux kernel 4.18 or the newer v5.15 Linux kernel – which performed better but, again, no comparison numbers are revealed.
Then we are told: “The NVMe-oF storage protocol was tested with both TCP and RoCE at the network transport layer. Each configuration was tested with 100 per cent read, 100 per cent write and 50/50 read/write workloads with full bidirectional network utilisation.”
Given this level of detail it is then absurd that the blog cites IOPS numbers without identifying which ones were with RoCE – it does say a couple were with NVMe/TCP – and which ones were all-read, all-write or a mixed read/write setup. It just gives us bald numbers instead.
However, on reaching out to NVIDIA it kindly supplied two tables detailing the specific numbers for NVMe/TCP and NVMe RoCE test runs:
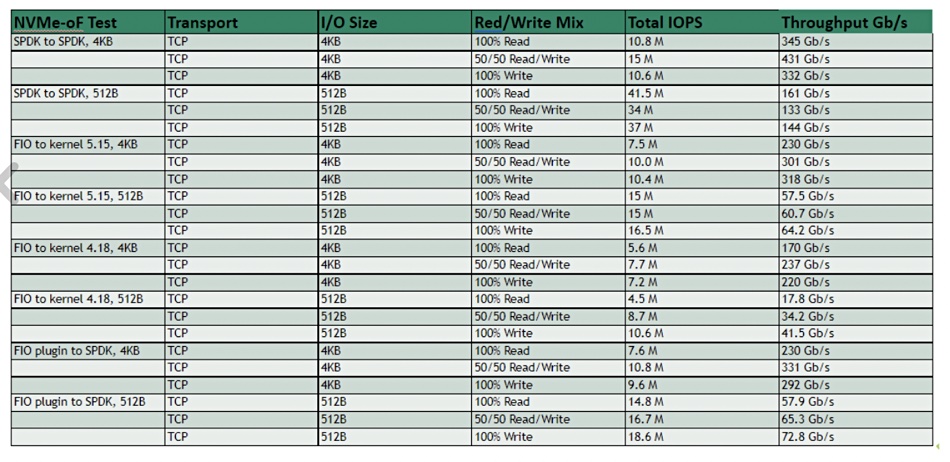
The 41.5 million IOPS number was achieved with NVMe/TCP using 512B data blocks in a 100 per cent read run. We were surprised, thinking it would have needed NVMe RoCE. But, surprise, guess what we found when we looked at the second table?
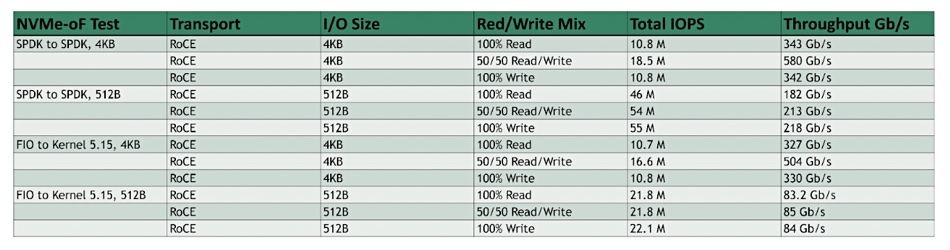
In fact, NVMe RoCE is faster than NVMe/TCP as the fourth line of the table shows, specifying the SPDK kernel, and showing a 46 million IOPS result with 512B blocks and 100 per cent reads. The fifth and sixth lines show 54 million IOPS, with 512B blocks and a 50-50 read/write mix, and 55 million IOPS with 100 per cent writes and 512B blocks. Why the blog highlights the 41.5 million IOPS number instead of the much higher 55 million IOPS number is a hard question to answer.
We understand from a source that the NVIDIA storage target served the data blocks from DRAM and not from NVMe SSDs, which make comparison to real world numbers hard. Here are two tweets confirming this;

And;

NVIDIA’s blog claims: “The 41.5 million IOPS reached by BlueField is more than 4x the previous world record of 10 million IOPS, set using proprietary storage offerings,” but provides no reference to this 10 million IOPS test so we have no official idea of the system configuration used.
Fungible comparison
We believe it refers to a Fungible system which was rated at 10 million IOPS using its Storage Initiator cards. This test system featured a Fungible FS1600 24-slot NVMe SSD array as the storage target. The app server was a Gigabyte R282-Z93 box with a dual 64-core AMD EPYC 7763 processor, 2TB of memory, and five PCIe 4 expansion slots.
These slots were filled with Fungible S1 cards and they linked to single FS1600 equipped with two Fungible DPU chips. A 100Gbit switched Ethernet LAN linked the Gigabyte server and FS1600 and 4K data blocks were used in a 100 operation cent read situation.
So a single Gigabyte 128-core server with 5 x Fungible DPUs linked over 100GbitE to a twin-DPU storage target reached 10 million 4K read IOPS. The NVIDIA test reached 56 million write IOPS with 512B blocks, using a 160-core server and dual BlueField DPUs talking over a 4 x 100GbitE link to a 160-core storage initiator front-ended by two Bluefield-2 DPUs with data served to/from /dev/null. It certainly appears that NVIDIA basically ran a network test and used a far more powerful storage server than Fungible and possibly 4x the bandwidth.
We’d love to have the detailed performance numbers and link configuration/protocol details for both suppliers’ tests, and understand the price/performance numbers here, to be able to properly compare the NVIDIA and Fungible setups. But, as it is, all we can see are two suppliers pushing out hero numbers with NVIDIA’s being more detailed and an impressive 5.5 times higher than Fungible’s but artificially so. Let’s see what Fungible can do to match, exceed or rebut it.


