SSD supplier Micron announced MLPerf v1.0 Storage Benchmark results for its 7.68 TB 9550 NVMe SSD, saying it offers the performance required to support a large number of accelerators and AI workloads.
The first set of MLPerf Storage v1.0 benchmark results, testing storage product and system throughput for accelerators (GPUs) in AI training runs, was published a few days ago. Micron said it couldn’t make its test results public then as it was in the quiet period leading up to its SEC quarterly results announcement.
Micron says the 9550 can sustain up to:
- 58x H100 accelerators training ResNet50 at 10.2 GBps
- 13x H100 accelerators training CosmoFlow at 7.2 GBps
- 4x H100 accelerators training 3D-Unet at 9.9 GBps
or
- 115x A100 accelerators training ResNet50 at 10.5 GBps
- 20x A100 accelerators training CosmoFlow at 7.1 GBps
- 8x A100 accelerators training 3D-Unet at 9.3 GBps
Micron also published MLPerf v1.0 Storage results for its 30.72 TB 6500 ION SSD in support, it said, of AI use cases requiring high storage capacity. It can sustain up to:
- 72 A100 accelerators training ResNet50 at 3.6 GBps
- 15 A100 accelerators training CosmoFlow at 5.3 GBps
- 3 A100 accelerators training 3D-Unet at 4.47 GBps
or:
- 37 H100 accelerators training ResNet50 at 6.66 GBps
- 9 H100 accelerators training CosmoFlow at 4.98 GBps
- 1 H100 accelerator training 3D-Unet at 2.9 GBps
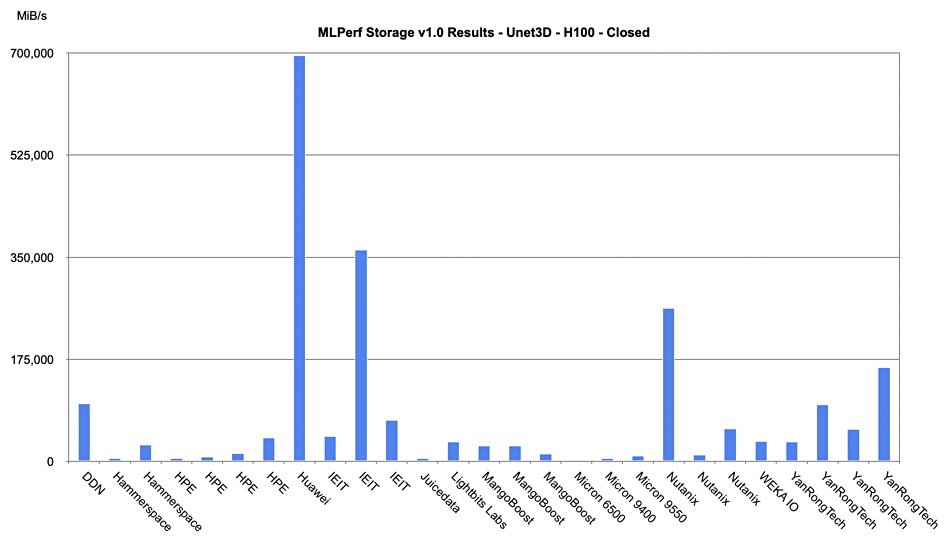
As a way of trying to compare Micron’s SSD results with other submitted results, we charted the overall 3D-Unet workload scores running with H100 GPUs with these Micron SSDs included:

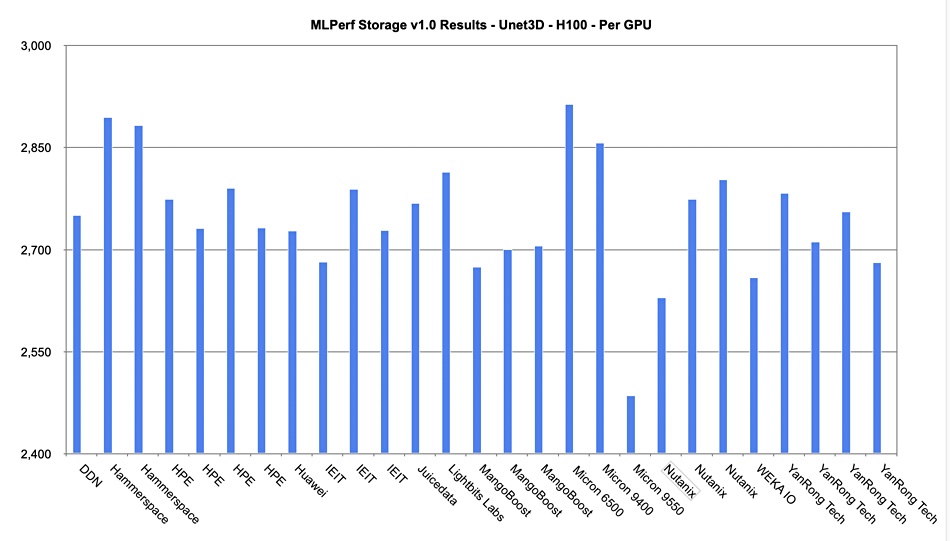
As you can see, the Micron SSDs barely register on the chart as their raw MiB/s number is so low. Normalizing these scores per GPU, dividing the MiB/s rating by the number of accelerators (GPUs), we get the following much more readable chart:

The 6500 has the highest result at 2,914 MiB/s, with the 9400 in fourth place with 2,856.5 MiB/s. The 9550 lags the rest with 2,486 MiB/s.
Ideally, we would like to produce similar charts for the 3D-Unet workload on A100 GPUs, and the CosmoFlow and ResNet50 workloads running with A100 and, separately, H100 GPUs.
The MLPerf Storage benchmark permits both single drive and multiple drive system submissions, although each type of submission can hold vastly different dataset sizes. Our understanding is that single drives could be used in real-world inferencing workloads, but not training runs, as the datasets would generally be too small. We note that MLPerf Storage tests training performance, not inferencing workloads.
See Micron’s video blog about its MLPerf Storage SSD results here and check out a technical brief here.
Analysis and comment
The MLPerf Storage spreadsheet table is quite difficult to read. It seems to be ordered by the public ID column, which seems counter-intuitive as people will surely want to search for vendors. Secondly, the vendors are not organized alphabetically; Micron appears in two separate entry groups, for example. That makes it harder to find all the Micron results.
Then there are three workloads and two accelerator types, which means you have to separate out the workload and the accelerator type to be able to compare vendors. Some systems are available while others are in preview. Some results are comparable with others – so-called Closed – while others are not – so-called Open. A person inspecting the MLPerf Storage results table has to understand which supplier is good at what workload with what system, which accelerator, and whether the system test is Closed or Open, and then whether it is available or in preview. This is possibly the most complicated and hard-to-understand benchmark this writer has encountered.
Workload vs overall performance
MLPerf Storage is a multi-workload benchmark with 3D-Unet, CosmoFlow, and ResNet50 training scenarios. The SPEC SFS 2020 benchmark is another multi-workload affair. It’s a file-serving benchmark with five different workloads: software builds, video streaming (VDA), electronic design automation, virtual desktop infrastructure, and database. Each category test results in a numerical score and an overall response time (ORT). There is no system price measure and so no price-performance rating.
A third multi-workload benchmark is the Storage Performance Council’s SPC-2 benchmark, which measures overall storage array performance in throughput (MBPS) and (discounted) price-performance terms. These numbers are calculated from three component workloads – large file processing, large database query, and video-on-demand – and the test results present an overall throughput score, SPC-2 MBPS, and a price-performance value based on the test system price divided by the MBPS rating. Vendor and system comparisons are relatively simple to make.
Unlike SPC-2, MLPerf Storage has no overall measure of performance across its three workloads and no price-performance measure either, making supplier and system comparisons more difficult.


