All-flash array supplier revenues turned down in the first 2022 quarter, except for NetApp, whose share has grown for six straight quarters.
Such is the picture painted by Gartner in its external storage market report for the quarter. Wells Fargo analyst Aaron Rakers told his subscribers: “The all-flash array market (solid-state arrays) grew 13 percent y/y vs. +14 percent y/y in 4Q21 (62 percent of primary storage rev. and 21 percent of secondary storage), while hard-disk drives and hybrid array revenue declined 6 percent y/y.”
In general the primary storage market eked out growth, up just 2 percent year-on-year (y/y), with the secondary storage market growing four times faster, at 8 percent, while the backup and recovery market went down 2 percent. We envisage that public cloud backup and recovery revenues grew.
Total external storage capacity shipped rose 5 percent year-over-year with the all-flash part of that shooting up 30 percent, accounting for 16.8 percent of all capacity shipped, an all-time high.
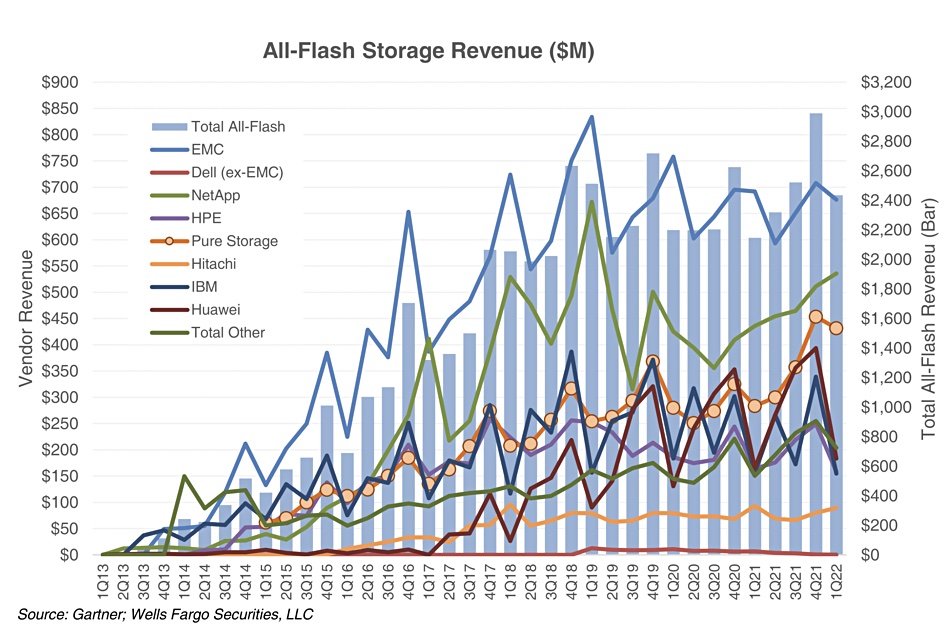
A Gartner graph shows how the main vendors fared:
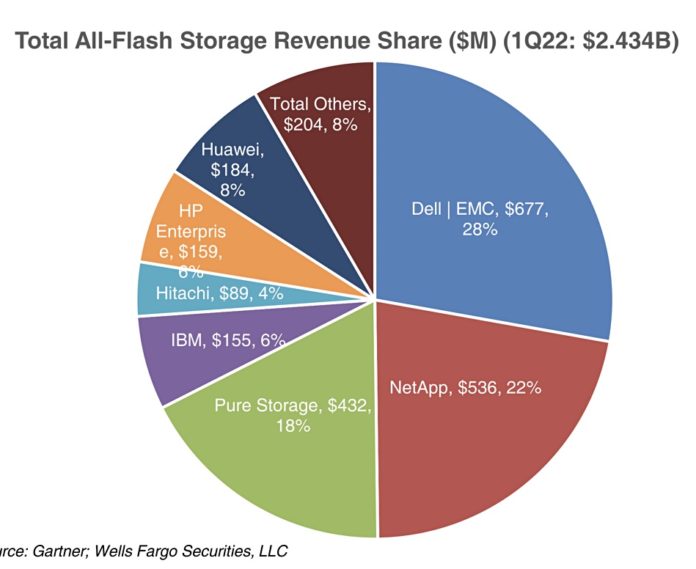
On a year-on-year basis Dell remained top of the external storage heap with a 31 percent share, down from 34 percent a year ago. Its all-flash market share went down from 32.5 percent a year ago to 27.8 percent: $677 million.
NetApp had the second largest all-flash array share, at 22 percent and $536 million, up from the year-ago 20.3 percent. Its total storage revenues were up 6 percent year-over-year and its total external storage market share increased to 14.4 percent from the year-ago 14 percent.
Pure Storage was in third place with a 17.7 percent share of the all-flash market, $432 million, up from 13.2 percent a year ago. Rakers points out that Pure’s flash capacity shipped grew 77 percent while NetApp’s flash capacity shipped was up 12 percent over the same period.
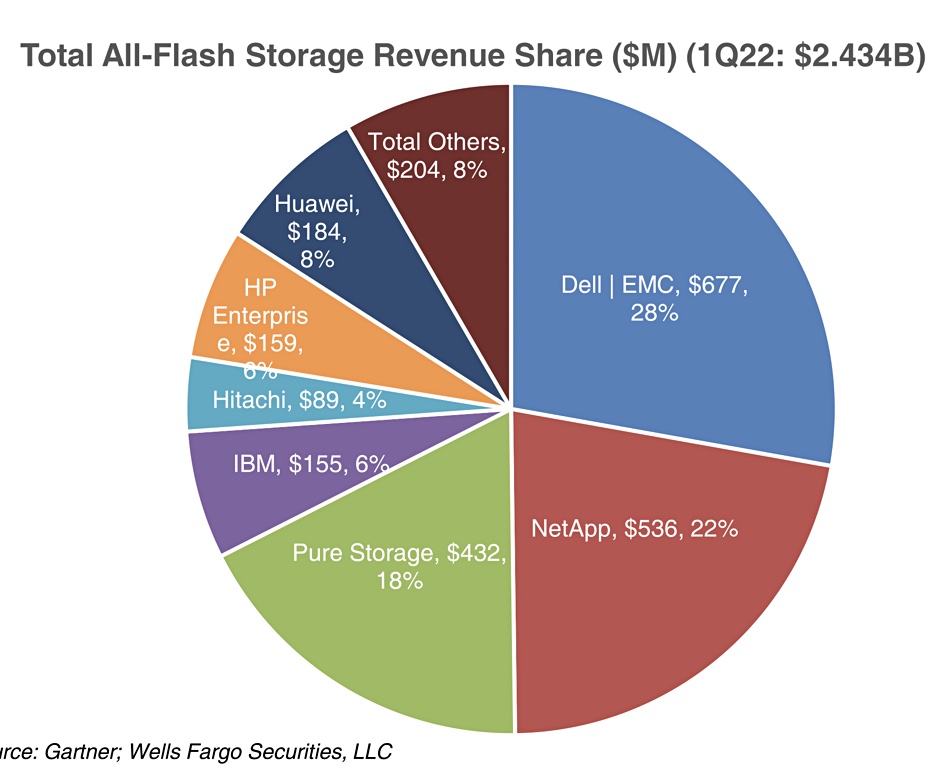
HPE had a poor quarter. Its overall storage revenue went down 8 percent year-on-year to $184 million, and its share declined to 7-8 percent from the year-ago 10.3 percent. From the AFA point of view, its market share of 6.5 percent was down from the year-ago 7.6 percent.
The Gartner vendor market share trends chart shows that IBM lost share while Huawei grew a little and Hitachi was flat. Huawei’s quarter-on-quarter downturn was large but it’s a seasonal pattern and has been seen for five years in a row – indicating it will most probably bounce back.
Interestingly, Pure also exhibits a seasonal Q4 to Q1 downturn pattern and it will likely grow strongly in Q2, like Huawei. Can Pure grow its revenues fast enough to catch up with NetApp?


