


Cloud storage provider Backblaze has found that Seagate disk drives failed more often in the last quarter than those from other suppliers. It accumulates failure statistics every quarter for its tens of thousands of disk drives and uses these to calculate life time annualised failure rate (AFR) for each drive type it buys. The raw data is available here.
At the end of September 2021, Backblaze was monitoring 190,826 hard disk drives used to store data, with at least 60 drives of each type. It has tabulated and presented this data in a blog by staffer Andy Klein who writes: “The only drive model that recorded zero failures during Q2 was the HGST 12TB drive (model: HUH721212ALE600) which is used in our Dell storage servers in our Amsterdam data center.”
We thought it would be neat to represent the numbers in term of the AFRs for each supplier and its products, and also calculate the average AFR per supplier. Here’s the chart:
Although the actual AFR percentages are low, there are large differences between individual disk drive products and between the average AFRs for each supplier. Two Seagate drives failed markedly more often than other suppliers, with a Seagate 14TB (model ST14000NM0138) drive the most failure-prone at 4.86 per cent. Its 4TB drive was the second most failure-prone product.
Klein says this about the failing 14TB Seagate drive: “These drives, while manufactured by Seagate, were provisioned in Dell storage servers. As noted, both Seagate and Dell were looking into the possible causes for the unexpected failure rate. The limited number of failures, 26 this quarter, have made failure analysis challenging.”
Seagate’s overall average AFR across its drives is 1.62 per cent, which compares to Toshiba at 1.134 per cent, the old HGST (now WD) at 0.445 per cent, and champion Western Digital Corp (WDC) at 0.355 per cent.
SSD AFR curve
Backblaze also tracks its SSD population’s AFR and compares it to the overall disk drive AFR curve to see if SSDs will fail at the same rate over time as disk drives. It’s now accumulated four quarters of comparative data and the curves are quite similar — although the SSD curve values are at a lower level than disk drives:
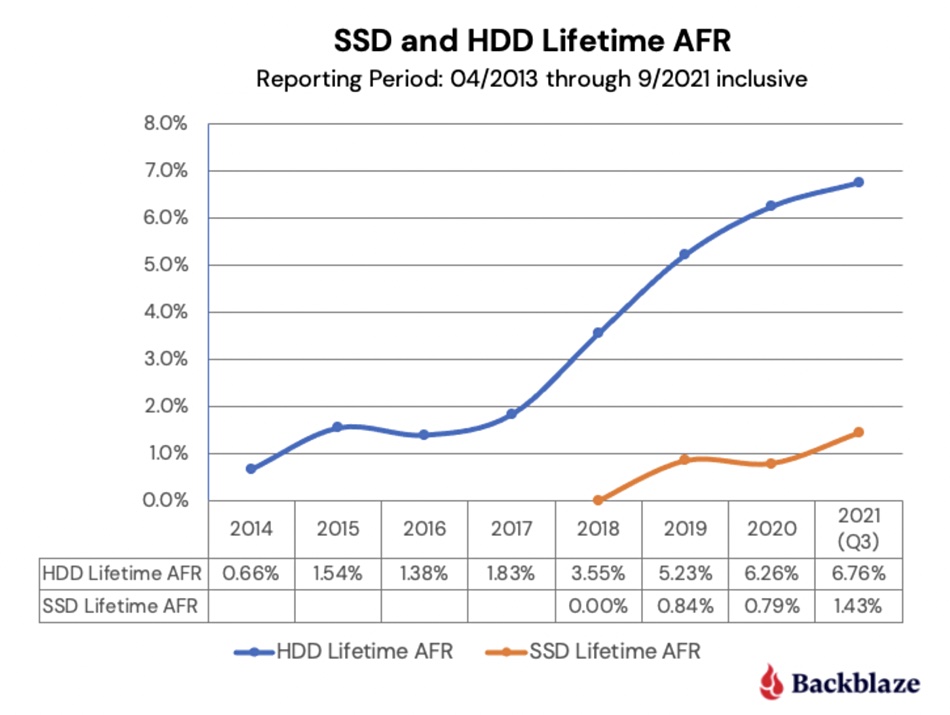
From this point on the disk drive AFR rises up fairly steeply. Backblaze doesn’t know if the SSD AFR curve will do the same thing and will be looking at the next quarter’s SSD failure rate with some interest.


