


Analysis. An enterprise that is in the market to buy storage systems that attach to Nvidia’s DGX A100 GPU systems will most likely conduct a supplier comparison exercise. Multiple storage vendors are quoting bandwidth numbers for shipping data to Nvidia’s DGX A-100 GPUs. So, that should make the exercise nice and easy.
Not so fast. Unless they use exactly the same configuration components and connectivity, quoted throughput numbers are effectively meaningless for comparison purposes. And yes, the vendors are using different set-ups to arrive at their numbers.
Let’s diagnose the problem.
- There is no one standard way of measuring data delivery rates to Nvidia’s GPUs, such as the bandwidth from one array across a certain class link to a single A-100 GPU box.
- Storage suppliers may use a single array or a scale-out server-based setup with inherent parallelisation meaning higher throughput.
- The suppliers may use a host server CPU/DRAM bypass technology like Nvidia’s GPUDirect or they may not, in which case they will be slower.
- The suppliers may have a direct array-to-GPU server link, with no intervening server. They may be in an Nvidia DGX POD reference architecture (RA), with quoted speeds summed across several A-100 systems.
- Quoted speeds in reference architecture documents may be exceeded many times by theoretical numbers from scaled out storage nodes. For example, NetApp and Nvidia hit this number in an RA, “A single NetApp AFF A800 system supports throughput of 25GB/sec for sequential reads. They went on to say: “With the FlexGroup technology validated in this [NetApp] solution, a 24-node cluster can provide … up to 300GB/sec throughput in a single volume.” Yes, but… the RA configuration did not include a 24-node cluster.
Blocks & Files has tabulated DGX A-100 delivery data rate numbers quoted by six data storage vendors, and listed certain configuration details such as GPUDirect use.
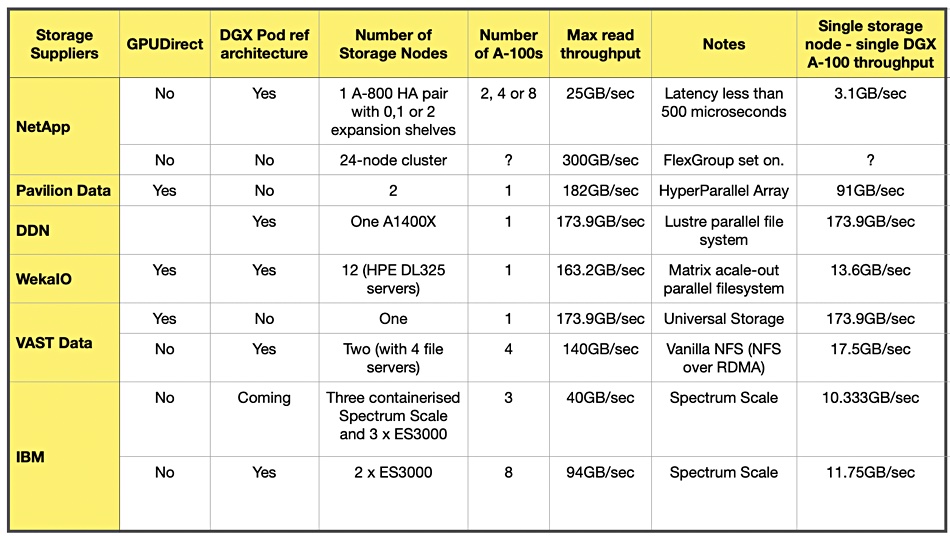
We specifically note the number of storage arrays or nodes and the number of target A100 systems. Using these numbers and the quoted throughput, we have estimated the single storage node data delivery rate to a single A100 GPU system. The results are in the far right column.
Pears v. Bananas?
The variation is immense, from 3.1GB/sec to 182GB/sec. – so immense that its cast doubt on the validity of my calculated numbers. Either the base numbers used in the calculations are wrong or the basis for making the comparisons is wrong.
Help us out here. Do you think it is valid to compare a NetApp A-800 high-availability pair (3.1GB/sec) with a Pavilion HyperParallel array (91GB/sec) and VAST Data (173.9GB/sec)?
One problem is answering the question; what is a storage node? A Pavilion HyperParallel array with 2.2PB raw capacity is a two arrays. But a WekaIO system runs in a cluster of storage servers. How many cluster nodes equate to a single Pavilion array?
How does a VAST Data array of N petabyte capacity equate to an IBM Spectrum Scale cluster of ES3000 nodes and associated Spectrum Scale servers? Should these comparisons be made on a raw capacity basis or on a number-of-controllers basis?
The data and comparison methodology is not available to do this, certainly not to us. There is no standard benchmark for testing data delivery rates to Nvidia’s DGX A100 GPUs that could provide such comparative data either.
Excelero has said it is working with Nvidia to support the A100 and it may well produce a throughput number for its NVMESH technology. But that number will be effectively useless unless there is a way to compare it to the other suppliers’ numbers. Caveat emptor.


