


Cloud storage provider Backblaze has found its SSD annual failure rate was 0.98 percent compared to 1.64 percent for disk drives, a difference of 0.66 percentage points. It also noted that SSD manufacturers’ SMART stats were not so smart.
Backblaze stores customers’ backup and general storage data in its cloud datacenters. These are composed of disk drive pods and servers that use SSD boot drives. It has published disk drive annual failure rate statistics for some years and has now accumulated enough SSD data to publish SSD AFR numbers for the first time.
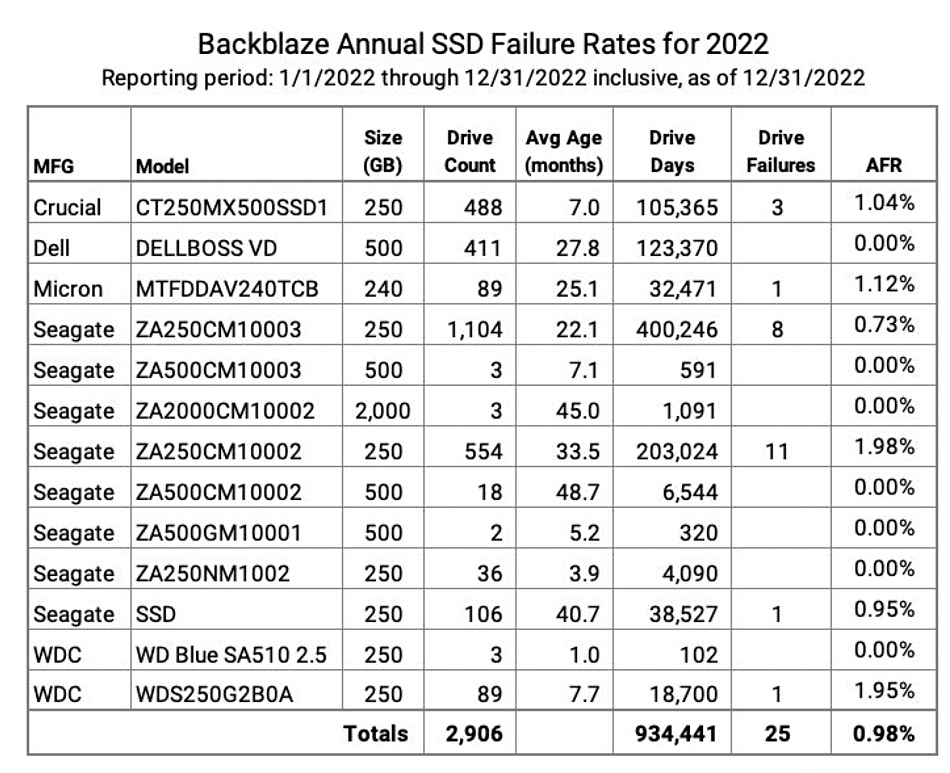
The surprise is that SSDs are not much more reliable than disk drives with their mechanical components – the moving read:write heads and spinning platters. Here is its SSD data table:
An equivalent table of its disk drive statistics provides comparative data:
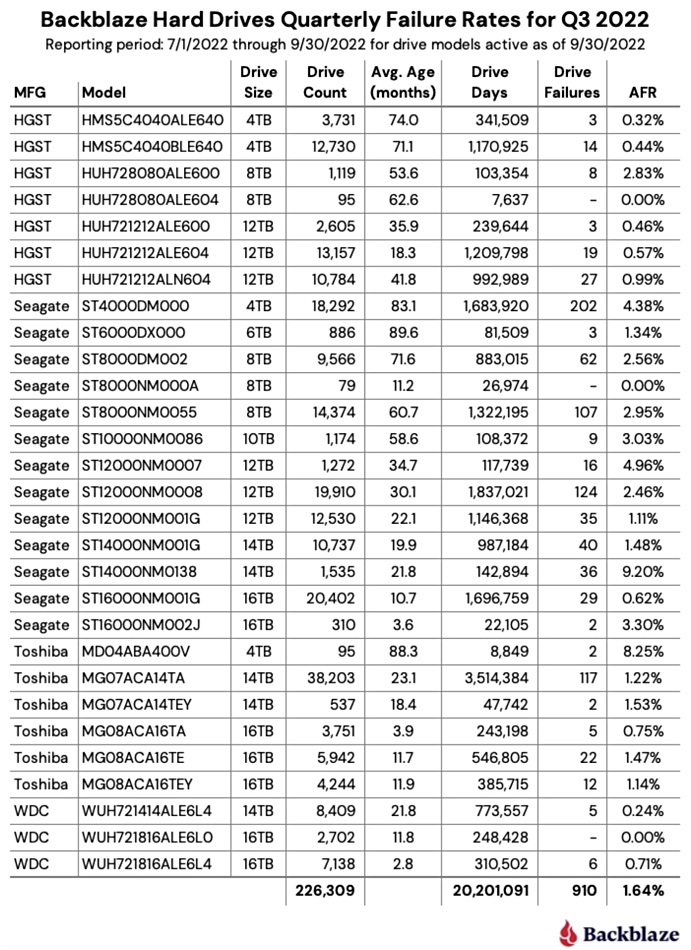
Based on its SSD and HDD AFR percentages, the difference is 1.64 – 0.98 = 0.66, not even one in 100 drives. In a 1,000-HDD population, we would expect 16.4 to fail while with 1,000 SSDs we expect 9.8 to fail – a difference of 6.6 drives. The reliability difference is much less than we would have expected.
The failure reasons are not known, and why should they be? Only an SSD manufacturer would have the staff and equipment needed to diagnose a failed SSD.
Backblaze’s Andy Klein writes: “There were 13 different models in use, most of which are considered consumer grade SSDs … Six of the seven models had a limited number of drive days – less than 10,000 – meaning that there is not enough data to make a reliable projection about the failure rates of those drive models.”
Not so SMART
Klein notes that the SMART (Self-Monitoring, Analysis, and Reporting Technology) used for drive state reporting is applied inconsistently by manufacturers. “Terms like wear leveling, endurance, lifetime used, life used, LBAs [Logical Block Address] written, LBAs read, and so on are used inconsistently between manufacturers, often using different SMART attributes, and sometimes they are not recorded at all.”
That means you can’t use such SMART statistics to make valid comparisons between the drives. Come on, manufacturers. Standardize your SMART numbers.
He did find the SMART temperature recording was standard enough to permit a heat comparison between the SSDs Backblaze used, and found a bell curve, a normal distribution. He also found that the SSD temperatures were higher than that of Backblaze’s disk drives. “For 2022, the average temperature was 34.9 degrees Celsius. The average temperature of the hard drives in the same storage servers over the same period was 29.1 degrees Celsius.”
This was an odd result. Klein writes: “One possible reason is that, in all of our storage servers, the boot drives are further away from the cool aisle than the data drives. That is, the data drives get the cool air first.”
He looked to see if there was a relationship between SSD temperature and failure, plotting a curve for the failed drives. “We attempted to plot the same curve for the failed SSDs, but with only 25 failures in 2022, the curve was nonsense.” It was simply not statistically valid.
He says his SSD population size limits statistical validity. “We acknowledge that 2,906 SSDs is a relatively small number of drives on which to perform our analysis, and while this number does lead to wider than desired confidence intervals, it’s a start.”
Indeed, and it’s data we have not seen before. Keep it coming, Backblaze.


