


SSD controller software startup Burlywood is claiming its FlashOS software outperforms Kioxia, Micron, Samsung, SK hynix and Solidigm drives in write speed and latency consistency, saying it achieves vastly more drive writes per day as well.

Burlywood co-founder and CTO Tod Earhart told B&F in a briefing that existing SSD benchmarks were based on hard disk concepts and do not predict real-world SSD performance. Neither do IOPS and bandwidth numbers based on 100 percent random or sequential read and write workloads. Real-life workloads are mixed – reads and writes, random and sequential IO.
A processor’s performance does not degrade over time but commercially available SSDs do. Drives from all the major manufacturers exhibit pronounced declines in their write bandwidth performance as they age and experience more drive fills. Earhart provided a chart he said showed this:
The chart appears to indicate drives from Kioxia and others exhibit a 20 to 75 percent decline in bandwidth as they age, measured in drive fills. In contrast, Burleywood claims its own drive, the DC-2122 (light blue curve on the chart), has a higher, steady, and more predictable write bandwidth state.
Write amplification factor
These measurements are taken using an asymmetric hot/cold mixed workload. Hot/cold refers to an SSD workload characteristic that an SSD has so-called hot regions of cells which are written more frequently than cold regions. Internal SSD wear-leveling processes counteract this but use SSD controller time. Because of an SSD’s internal processes and its block-erase-write property, an SSD can need to write more data internally than is sent to the drive. As NAND cells wear out this is not a good thing.
Wear leveling and garbage collection cause additional writes such that 1MB of data sent to the drive can cause, for example, 1.1 to 1.25 to 1.5MB of actual data to be written. The amount of write data is amplified. The write amplification factor number should be as close to 1 as possible, with 1 indicating that 1 unit of data sent to the drive causes 1 unit of data to be written inside the drive. But this is rarely the case, and certainly not in real-life production workloads.
Earhart measured the write amplification factor of different manufacturers’ drives using a simulated production workload and charted the differences:
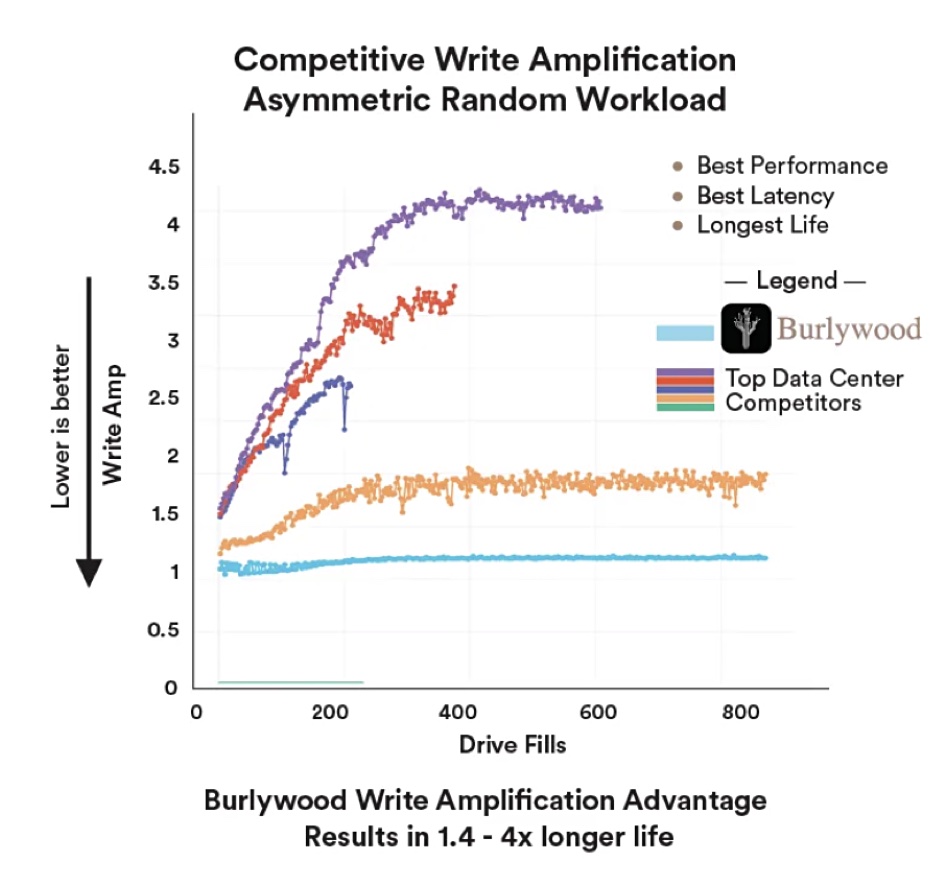
This chart hows the write amplification factor (WAF) changes as a drive ages through drive fills, a variation on the classic fresh-out-of-the-box performance phenomenon. It is pretty much the inverse of the previous chart, albeit with Kioxia missing. Earhart says Burlywood-powered drives have a write amplification factor advantage which results in a 1.5x to 4x longer drive life than the other manufacturers on the chart.
This is like having an electric vehicle with, say, a 250-mile range limit. Give it a controller software upgrade and the range increases. That’s what Burlywood claims its controller software achieves with SSDs – extends their endurance.
Earhart looked at how his controller software would lower the WAF and so increase the number of drive writes per day with different classes of NAND in Samsung drives:
- Enterprise TLC – Samsung – 1.6 DWPD with Burlywood delivering 4.9 DWPD
- Consumer TLC – Samsung – 0.5 DWPD with Burlywood delivering 1.6 DWPD
- QLC – Samsung – 0.2 DWPD with Burlywood delivering 0.8 DWPD
He also measured Samsung and Burlywood-powered drives on how many TB/day of writing they could support during a five-year warranty period:
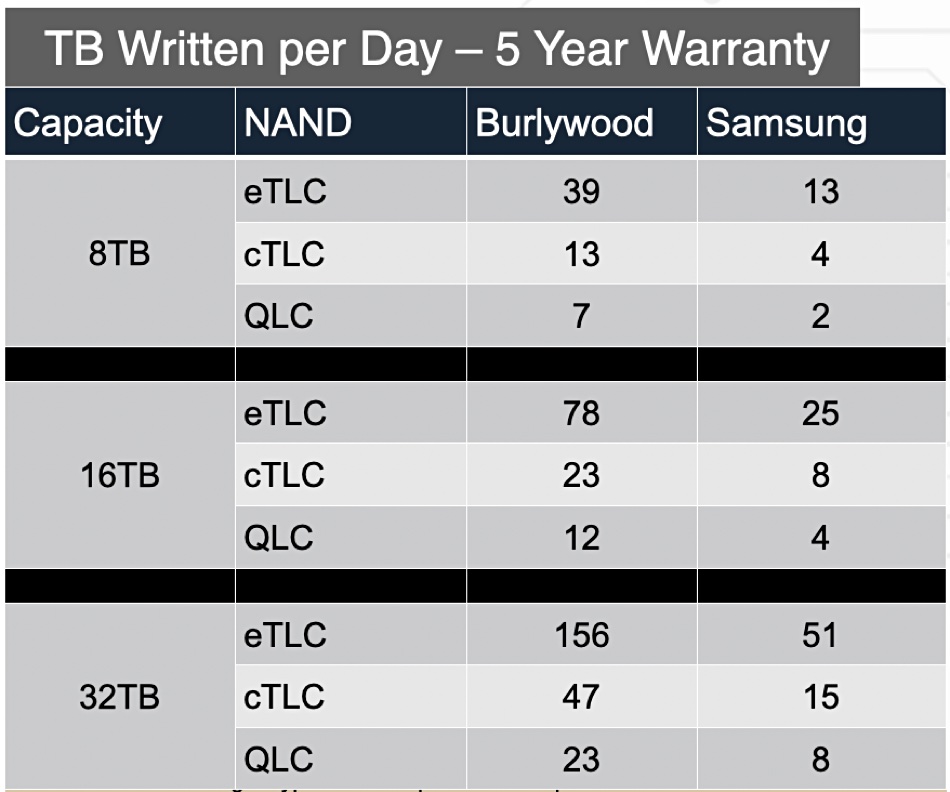
The differences appeared to be significant. A 32TB Samsung drive built from enterprise-class TLC NAND supported 51TB/day for five years but Burlywood’s software apparently increased this to 156TB, a more than 3x increase.
That would mean a buyer of needing a 45TB/day capability could save money by using consumer-grade TLC flash instead of costlier enterprise-grade flash. Or, with an 8TB/day need, could use even cheaper QLC flash than either eTLC or cTLC.
Latency
An SSD’s ability to respond quickly to read and write requests, its latency, can also be affected by its internal processes. The quicker they are carried out, the lower the SSD’s latency and the more consistent it is as a drive ages. Earhart measured latency time over a drive’s life with the same manufacturers and discovered a spiky picture:
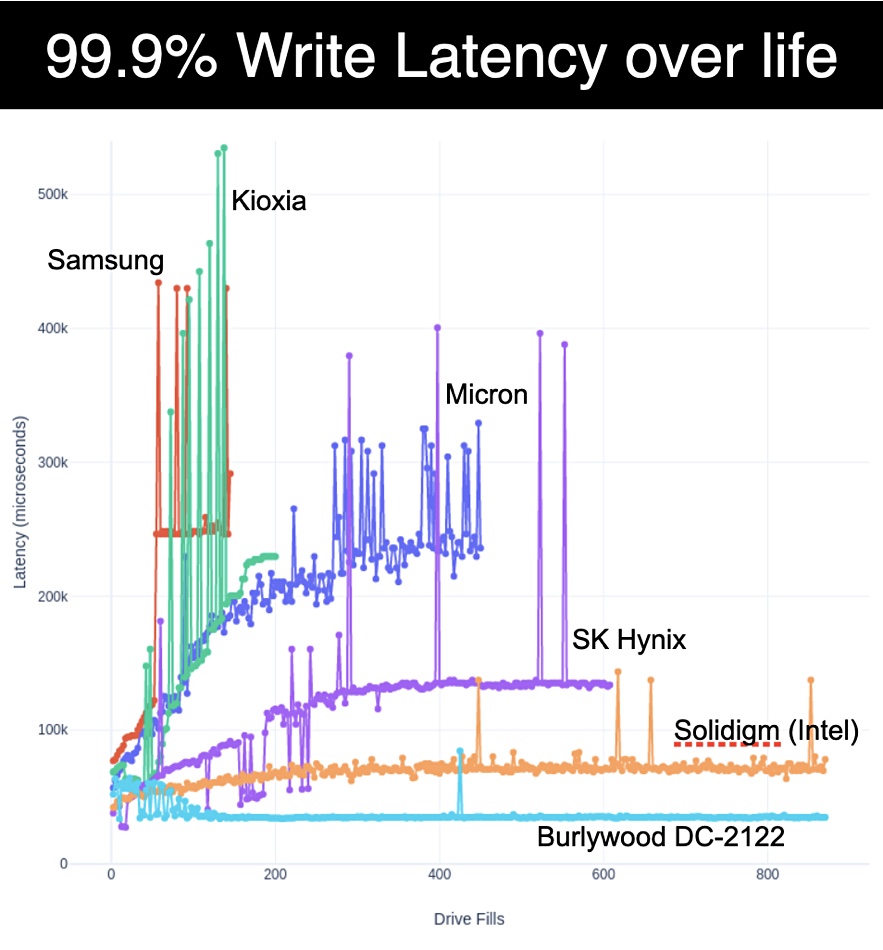
The Burlywood-controlled SSD provided consistently low latency past 800 drive fills. Solidigm was close, being very much better than SK hynix, Micron, Samsung and Kioxia, which were each progressively worse. A CSP/MSP or SaaS provider needing consistently low latency (fast responsiveness) to data access needs for its customer-facing applications would look at this chart and blanch.
Is this for real? Burlywood uses a simulated production workload after all. But if customers are experiencing lower and inconsistent performance over time and this continues for hundreds of drive fills then it is worth examining SSD latency with the real-world workload.
Customer characteristic
Customers would need to be deploying a hundred or more drives to make using Burlywood software worthwhile as they have to effectively customize drives by buying them and then loading the Burlywood controller software. They could buy SSDs from a Burlywood OEM such as Swissbit or they could have their own drives built by an intermediary, a contract manufacturer, for example, but that could require, say, a thousand-plus drives to make it worthwhile.
Commercially available SSDs are not presented with real-life performance data over the life of the drive. Presuming the data stands up, if they used Burlywood controller software with a sufficient number of drives then they would have longer endurance, consistently lower latency and their total cost of ownership would be much lower.
Read more about Burlywood’s thinking here.


