


Pure Storage has published a chart showing it has gained enterprise storage market share since 2014, while five incumbent vendors – HPE, NetApp, Hitachi, IBM, and Dell EMC – have lost share. But Huawei is not shown, and we think it gained even more market share over the period.
The chart is based on numbers from IDC’s Quarterly Enterprise Storage Systems Tracker report up to 2021’s fourth quarter. IDC made supplier market shares public up until 2021’s second quarter, then only supplied them to paid subscribers.
Market share percentages have been normalized to zero at the start point for the chart and then the positive and negative changes, in 0.035 increments of market share, applied quarter by quarter until the end of 2021.
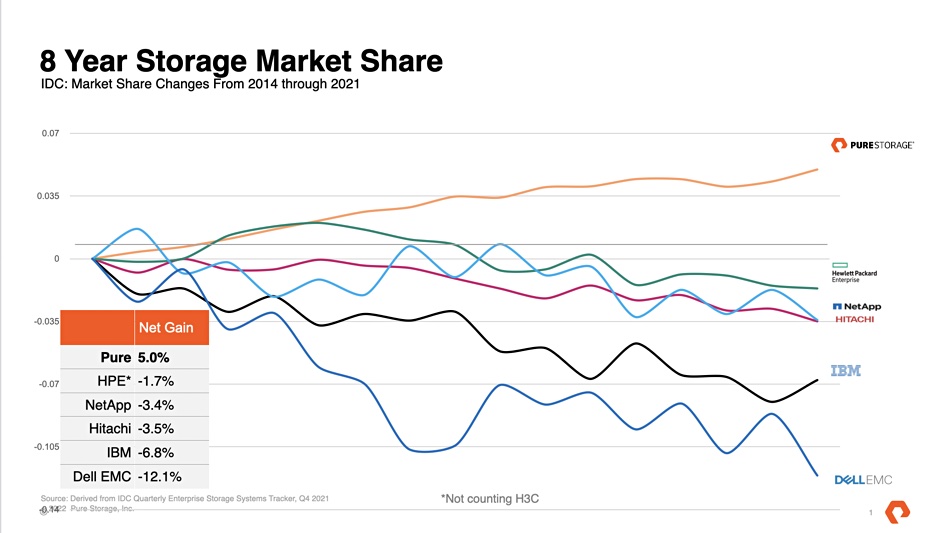
Pure says the chart shows changes from 2014 through to 2021, making it an eight-year view.
A Pure spokesperson told us: “Our competitors, especially Dell, like to talk about their growth in flash and their total market share. But what they don’t discuss is that it comes at the expense of their legacy business. They aren’t growing share – in many cases their external storage business is losing share. That’s because they are just changing their product mix from spinning disk to flash – we compete against both. In the meantime, Pure continues to grow and take share at our competitors’ expense.”
Reading directly off the chart, it seems the changes in absolute terms are quite small. But going by the pop-up box numbers, 0.035 indicates 3.5 percent of market share so Pure has gained 5 percent and the others lost varying percentages.
That makes 27.5 percent of market share lost by these five vendors, with Pure picking up 5 percent. Where has the other 22.5 percent gone? We think many of them have gone to Huawei rather than to other suppliers in general (IDC’s Rest of market category).
We think that because we tracked IDC’s Quarterly Enterprise Storage Systems Tracker reports from Q3 2016, when the vendor numbers were public, until Q2 2021 – not exactly matching Pure’s chart period but covering a lot of it. These numbers included Huawei, which Pure’s chart does not. Here is our chart showing the vendor revenue changes over that period:
This shows that Pure has the lowest market share of the mainstream vendors. Dell leads by a wide margin, followed by HPE, NetApp, Huawei then Hitachi, IBM, and Pure.
We calculated the vendor market shares at the Q3 2016 start of our chart and the Q2 2021 end point, and then worked out their change over the period:
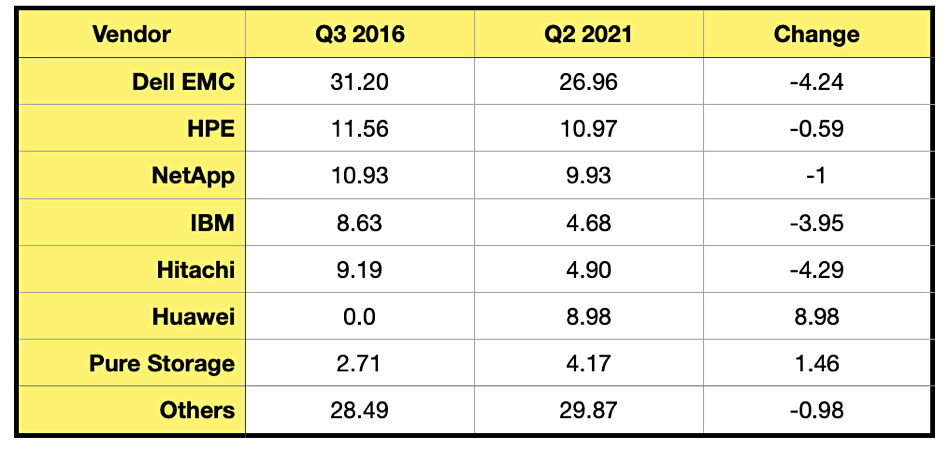
Only Pure and Huawei gained market share over the period, with Huawei gaining the most. These numbers differ from those on Pure’s chart. One contributing reason will be that the time periods are not an exact match, so Pure’s starting numbers are different. Another could be that IDC has revised its numbers, such as the total market size as well as individual vendor amounts per year, which is not unknown.
We note our market share changes don’t net out to zero – summing the numbers in the change column gets us -4.61 percent. There are errors somewhere here, and that might be due to retroactive IDC number changes or rounding errors. Hopefully the big picture should still be reasonably accurate, and, indeed, it largely agrees with Pure’s chart in terms of direction.
Thus Dell, HPE, Hitachi, IBM, and NetApp all lose share and Pure gains 1.46 percent – not a lot, because Huawei was up 8.98 percent.
A Pure spokesperson said: “In the past seven years Pure is one of two vendors to benefit from sustained and consistent market share growth across all storage due to our ability to take share from legacy storage vendors who are cannibalizing their existing install base.”
Of course Huawei storage is not available in the US, but it is elsewhere and outgrew Pure sixfold in global market share terms over the Q3 2016 to Q2 2021 period – if our calculations are correct. In North America, and probably Europe too, Pure trounced its competitors in market share.


