


IDC’s second quarter 2020 storage tracker revealed Huawei blew every other supplier away with its external storage revenue market share growth rate. In the same period Pure Storage saw its first market share drop for several years.
The overall external storage market exhibited a 5 per cent decline in revenue to $6.59bn.
Sebastian Lagana, research manager, Infrastructure Platforms and Technologies at IDC, set the scene in a prepared quote: “The external OEM market was down once again during the second quarter of the year as COVID-19 related impacts spread across the globe and hamstrung enterprise spending on external storage systems outside of China.”
William Blair analyst Jason Ader painted a slightly different picture for his subscribers: “Despite continued contraction in the external storage market, growth for the second quarter handily beat IDC’s expectations for a 17 per cent year-over-year decrease in revenue forecast in June 2020. This recovery had largely been telegraphed by the better-than-expected performance of storage leaders like NetApp, HPE, and Dell which all beat Street expectations (albeit low ones) in their most recent earnings reports.”
China was the fastest-growing region, up 18.3 per cent Y/Y, with Canada average selling price showing growth – up 1.1 per cent. The EMEA region slumped 7.8 per cent and Japan had negative growth of -4.7 per cent. Latin America was down 18.7 per cent, Asia/Pacific (ex-Japan and China) down 14.7 per cent while the USA was down 8.7 per cent.
Total capacity shipped rose 5.1 per cent to to 17.1EB. Top 5 supplier, market revenue numbers and changes were listed in an IDC table:
IBM’s revenue share grew 12.6 per cent. Apart from Huawei and IBM, every other supplier in the list experienced a Y/Y share decline; HPE revenues declined by 15 per cent, Dell Technologies by 10.7 per cent, and NetApp’s by 10.4 per cent.
Visualising this in a chart makes the scale of revenue changes more apparent:
There’s little change in relative positions. However IDC notes that revenue from Original Design Manufacturers (ODMs) selling to hyperscalers grew by 64.1 per cent Y/Y to $7.0bn and that’s reflected in the green rest-of-market line on the chart rising strongly. The capacity shipped to hyperscalers was 74.8 EB, a 122.1 per cent rise Y/Y.
The total all-flash array market rose 7.7 per cent Y/Y to $2.5bn while the hybrid flash/disk and disk array markets together brought in $2.5bn, but this represented a decline of 8.7 per cent Y/Y.
Ader noted: “Pure Storage saw its market share drop for the first time in several years, down to 4.1 per cent compared to 4.8 per cent in the first quarter, though flat compared to a year ago. We note this follows a tough quarter for Pure, which reported its lowest revenue growth on record in the most recent quarter (in part due to strength in its ratably recognised Pure-as-a-Service offering).”
A Pure spokesperson said: “IBM showed growth, but the bulk of IBM’s growth was in the high end segment as IBM storage continues to be driven by mainframe growth. IBM had some strong DS8K storage attach with its mainframe sales, which are absolutely still on refresh cycle. Pure showed low single digit contraction, much better performance than any of our other major global competitors (aside from IBM).”
Ader also presented an AFA suppler share chart with a surprising change:
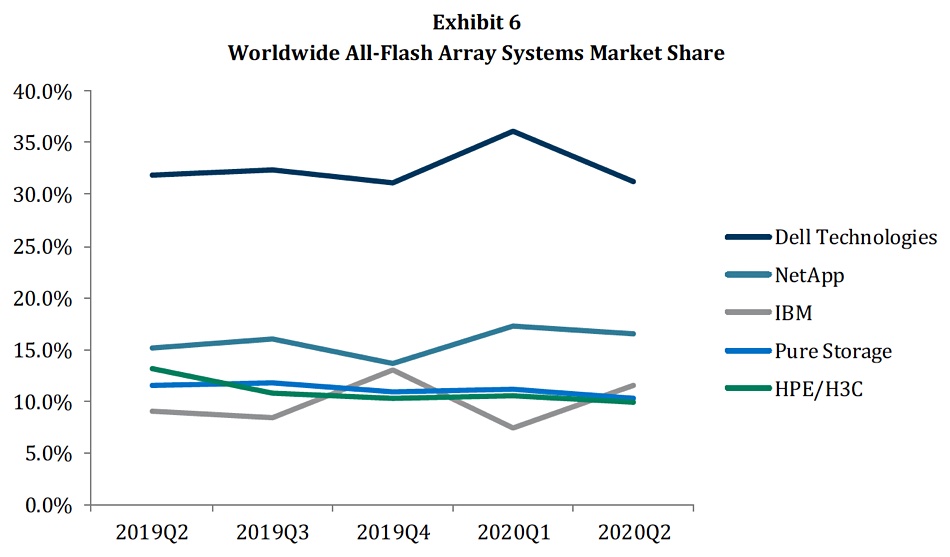
IBM’s AFA revenues have overtaken those of both Pure Storage and HPE.
Ader showed subscribe s a top 5 supplier share chart in the total storage market, in which he included storage in servers as well as external storage systems:
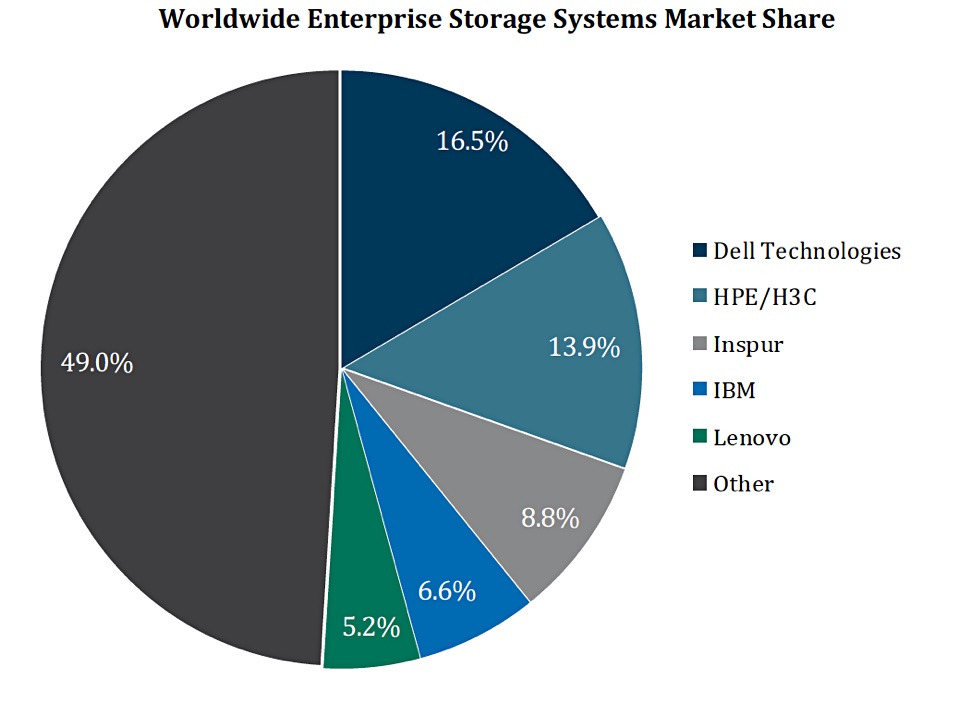
It shows Inspur has larger storage revenues than IBM.
Huawei’s growth in the external storage market could well turn down in the wake of the US government tightening the US-originated semiconductor screws on shipments to Huawei. Samsung and SK hynix will stop shipping DRAM and NAND product to Huawei on September 15.


