


WhatMatrix, the enterprise tech comparison site, has built a free, detailed online tool that delves into products from 10 hyperconverged suppliers. We like it.
The tool drills down into Nutanix, DataCore, Datrium, VMware, Pivot3, NetApp, Cisco, Dell EMC, Microsoft SDS, HPE SimpliVity and Scale Computing.
WhatMatrix ranks the comanies in the above supplier order too, and examines the general offer, design and deployment, workload support, server support, storage support, data availability, data services, and management categories. There are traffic light rankings for each category element, and element notes and overall category percentage stores.
A leaderboard tab shows the top six suppliers with arrow buttons – circled in the image below – to move to the right to see other lower-ranked suppliers and back again.
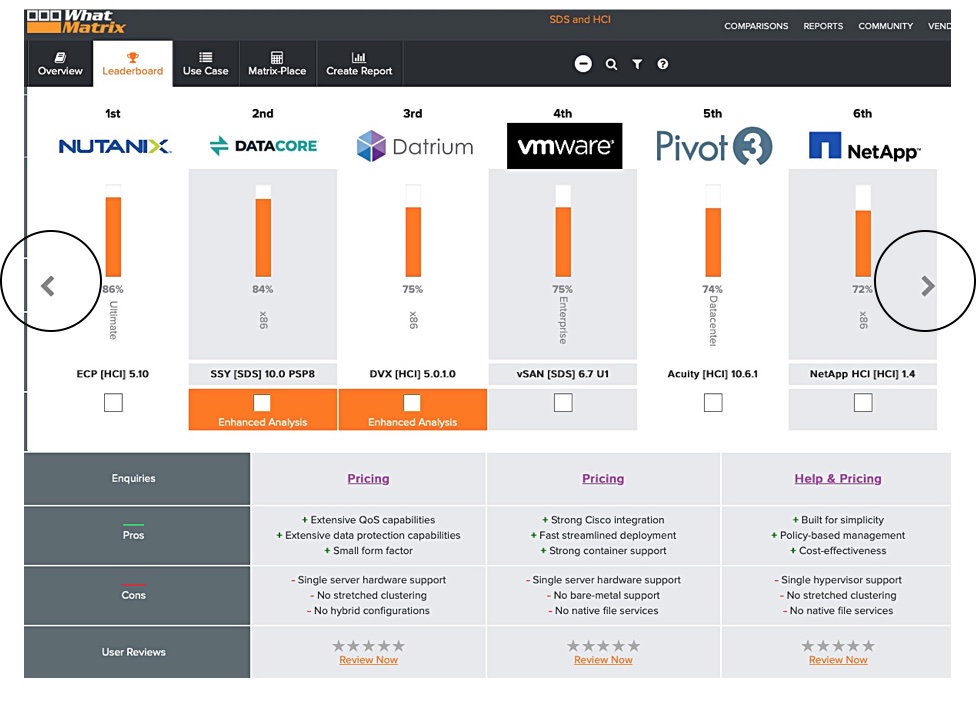
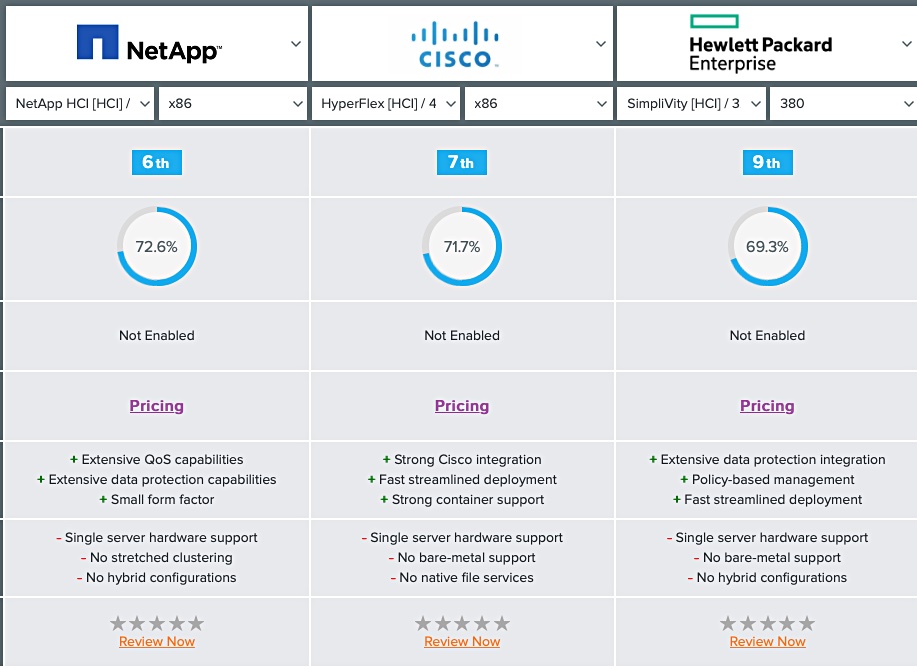
You can select up to three suppliers for detailed side-by-side comparisons and enhanced analytics are available for DataCore, Datrium and Scale Computing, with more to come.
This three-way report generation can take a minute or so with a few seconds wait before a spinning wheel appears on screen to indicate activity – we used a Mac.
The result consists of an overview followed by detailed comparison data:
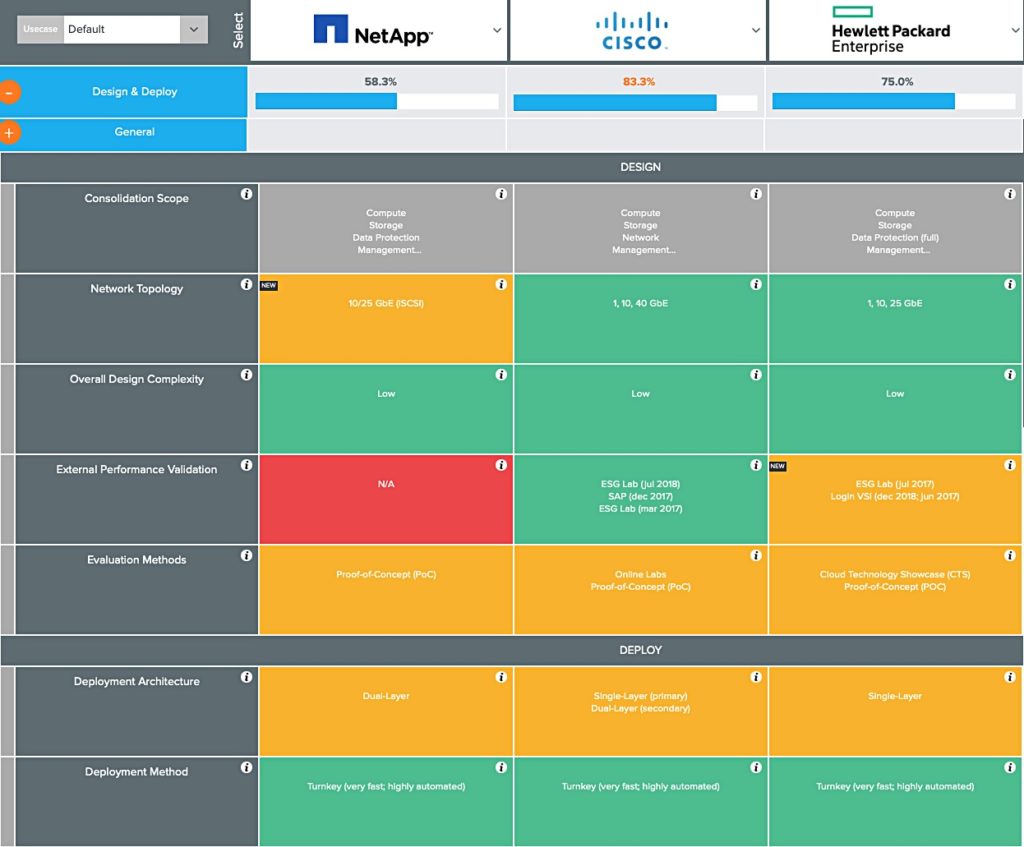
The traffic light categories are:
- Green – fully supported
- Yellow – limited support
- Red – Not supported
Grey boxes have information in them with no ranking. Clicking on a traffic light element box gets you detailed information, such as this external performance validation for HPE’s Simplivity:
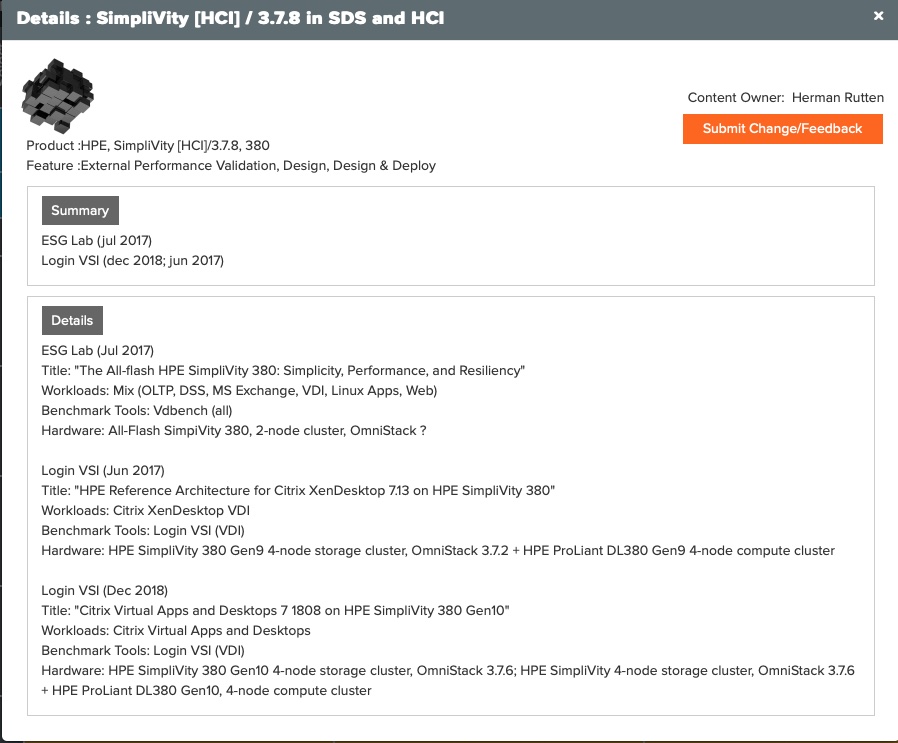
This lets you see the information source details and the content owner (in this case, WhatMatrix HCI and SDS consultant Herman Rutten) and submit feedback.
Net:net
WhatMatrix has produced the most detailed hyperconverged supplier-product ranking tool to date. It’s free, it’s detailed and it’s transparent.
Yes, it’s sometimes hard to read and the report generation response time is a tad slow. but the quality of the information means it is well worth putting up with these minor niggles.


