


Blocks & Files received an announcement from a startup called Calyptia that discussed data observability pipelines for petabytes of first mile data from thousands of servers. Bless. We hadn’t a clue what Calyptia was on about, and so we asked it.
Calyptia’s co-founder, Anurag Gupta, kindly answered our (no doubt to him very basic) questions.

Blocks & Files: I know that storage systems receive incoming data — write I/O. I know that containerised apps can write data to storage. I know about block, file and object data. But what is “first mile data”? What are data observability pipelines?
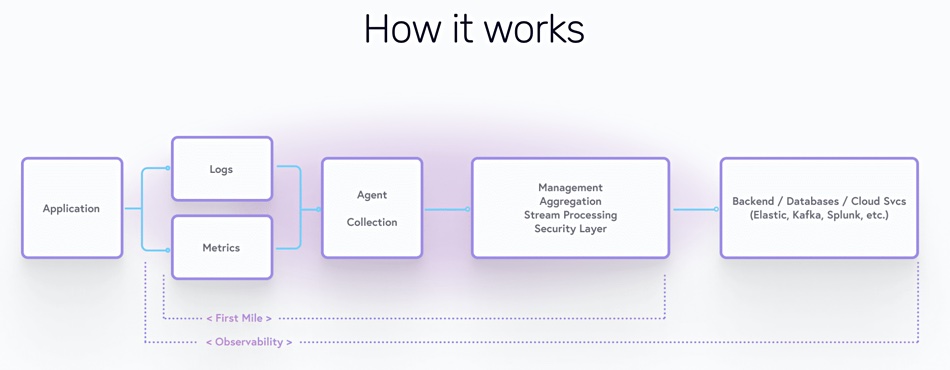
Anurag Gupta: “First mile” is about the journey of solving the challenges of collecting and preparing applications and infrastructure data to be delivered to its final destination. If we talk about this journey, consider a straight line from left to right, where in the left all the data collection happens. But it’s not as easy as it sounds: data comes from different sources and in different formats. If your final goal is to perform data analysis, there are a lot of tasks that need to be done before that — like data sanitization, context enrichment and most of the cases “bring the business logic to the data”.
When talking about a data pipeline, it means this journey of collecting, pre-processing but also offers the ability to route the data to the desired destination.
I would love the equivalent of a Wikipedia entry for an almost-clever 12-year-old explaining what’s going on here. It could say what log data is. How does it differ from other data — like a mail message, file, database record, or a stored object?
In this context, log data refers to system generated data that records “either events that occur in an operating system or other software runs — or messages between different users of a communication software.” And I followed your suggestion by taking that definition from Wikipedia 🙂
An example of log data could be I’m using a phone app. As I browse the app there is data generated that shows what buttons I might click or what action is taking place — this data is log data as it records what’s going on around the application. It does not include the actual email, or content that I am interacting with in the app.
This log data is essential for systems owners to understand what is happening in their environment and how to fix problems or optimise performance. Historically, because the amount of data is so large, the challenge has been how to quickly and efficiently parse and analyse the data to uncover any valuable insight within all the noise. Solutions have evolved to address this issue, but they have traditionally required expensive, time-consuming, data transport and centralised analysis and reporting. While they do provide some value, they cannot scale to support the current explosion in log data created from an equal explosion of distributed devices across every organisation’s environment.
Why is it important? What can people learn from it that makes it necessary to have special software to deal with it?
It’s about data hygiene. With the explosion of data over the past decade, and now within Kubernetes, customers need the ability to spin up an endless number of compute environments in a matter of seconds — meaning more services, more applications, and more data load. Additionally, IoT means more devices in more places all creating data and needing to be monitored, maintained, and secured. All of this means that it is getting more and more challenging to observe and understand what is going on in one’s environment. It becomes difficult to determine what is working and what is not, and what is secure and what is not, and the cost and time needed to stay ahead of the data becomes exorbitant.
Here’s a little history. Back in 2011, at Treasure Data, we saw that there was an inherent problem with taking many sources of data, machine data, network data application data, and sending that to many backends — whether that’s Splunk, Elastic, Data Dog, Amazon or Google services. What typically happens is you have these proprietary ways to send data to one back end with one or two sources, and there’s no way to multiplex or make that very flexible for many sources in many datas. And that’s really where the Fluent projects with Treasure Data came about. Fluentd was created 10 years ago in June of 2011, and then Fluent Bit was created in 2015.
Our goal today with Calyptia is to give customers a single, vendor-neutral solution to send data from multiple locations to multiple destinations, to do it in an open source accessible way with a plug-in ecosystem, and do it with very high performance, very full fidelity transformations parsing filtering routing, etc.
What is first mile (as opposed to second and third etc. mile) data?
First mile observability is the initial analysis of event data created by an organisation’s applications, networks, and machines. In a typical process, after creation, that data would flow through their IT systems via data pipelines such as Kafka or Confluent, and eventually end up in back-end data observability systems such as Splunk, Datadog, Elastic, or New Relic, where it is then processed and stored. “First mile” refers to that first step in this process — where data such as log files or performance metrics is created and collected.
What is an observability pipeline and why is it needed?
For us, it’s really about developers and practitioners being able to get insights about their systems, being able to diagnose, troubleshoot, respond, and become proactive about all of it. The earlier in the process one is able to gain insight, the quicker they can respond and the better their systems will perform — and as a result the business as a whole will benefit.
Why would you need to gather petabytes of first mile data across thousands of servers per day? What’s the reason for doing this?
Say I’m a large bank that is running thousands of servers a day to support all my users’ transaction needs. In a traditional observability system I will know when a server goes down or if something in my app malfunctions. However, with a strong first mile observability strategy, you can also understand if the data that is generated is being collected properly. You can understand what sources of data might be ballooning up your data charges. You can understand how data is flowing, and if it is going to the right destinations.
This problem compounds as we add infrastructure like Kubernetes, cloud workloads, ephemeral deployments, and additional backends.
Comment
Now we understand. First mile data is log data — metadata — about what system components are doing and how they are performing. Because the complexity and granularity of systems is increasing at a high rate — with thousands of servers each running thousands of containers in unbelievably complicated overall systems — diagnosing what is going on if there is a problem is difficult. So getting all that data from multiple sources in one place through a pipeline becomes critical. Then you can observe it, filter it and analyse it. Step forward Calyptia.


