


VAST Data has a 6 percent share of the datacenter all-flash array storage market, a chart based on IDC numbers has revealed. But IDC doesn’t agree with the validity of the chart.
Update: IDC rebut Zeoli and Flanagan use of its supposed number. 10 February 2024.
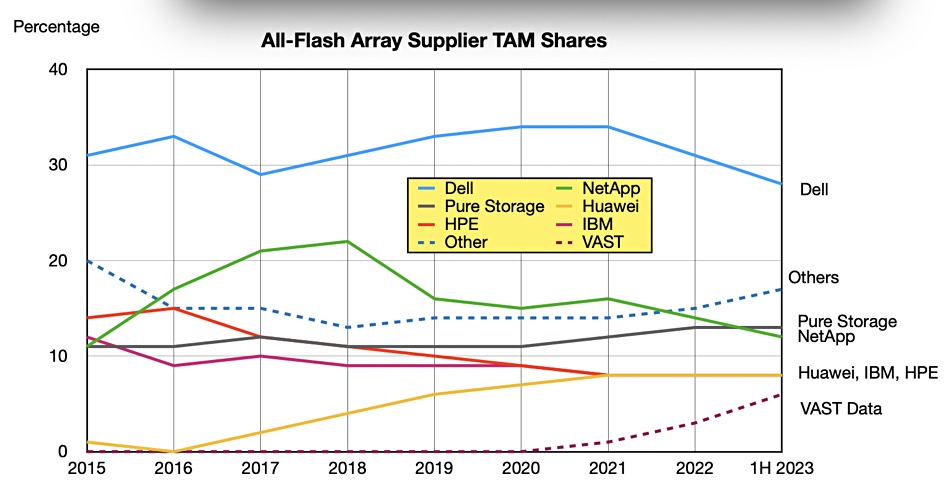
Microsoft Customer Success Account Manager and Generative Value newsletter publisher Eric Flaningam, a self-described value investor and tech analyst, provided the numbers and a chart in an X post. The chart shows how datacenter all-flash array (AFA) storage supplier market shares changed from 2015 to the first half of 2023. The market at that time was shared between Dell (28 percent), Pure Storage (13 percent), NetApp (12 percent), HPE (8 percent), Huawei (8 percent), IBM (8 percent), VAST Data (6 percent), and Others (17 percent). It used IDC numbers from a Data Gravity newsletter source.
As VAST is a private business and doesn’t reveal its revenues, this public depiction of its AFA market share total and growth from 2020 is something of a revelation. It has told us before it is growing fast and this chart seem to support that claim.
Most of the other suppliers are US-based and public – save for Huawei – thus we get to see their revenue numbers from quarterly reports. We can see that NetApp’s all-flash share has trended down from a peak in 2018 to which it rose quickly from 2015, HPE and IBM’s shares have trended down, while Pure’s has trended up. Huawei showed a substantial rise in the 2016 to 2021 period then flattened out at the 8 percent level.
Flaningam’s chart provides an opportunity to assess VAST’s revenues in the first half of 2023 by comparing its market share with other AFA suppliers whose storage revenues we do know. In the first half of 2023 Pure’s storage revenues were $1.46 billion and that equates to its 13 percent market share. This indicates that VAST’s 6 percent share equals just under half of Pure’s revenues in 2023’s first half, meaning $674 million?
VAST CMO Jeff Denworth told B&F that a direct comparison between Pure and VAST is invalid because: “We don’t take all of the revenue since we don’t sell hardware (versus Pure, which is a hardware company) even though our software drives different hardware platforms. Revenue is also not something we account like hardware companies do. So, no, the metrics are not congruent. In general, though, there’s a significant amount of annualized software subscription revenue (we take multi-year contracts) and other third-party hardware partners who are benefiting from our ascent.”
Bootnote 1
Data Gravity is a subscription-based newsletter produced by Chris Zeoli, a partner at Wing Venture Capital. He reproduced an IDC chart in a December 2023 edition which provide all-flash TAM (Total Addressable Market) percentage numbers for Dell, HPE, Huawei, IBM, NetApp, Pure, VAST and others from 2015 to the first half of 2023;
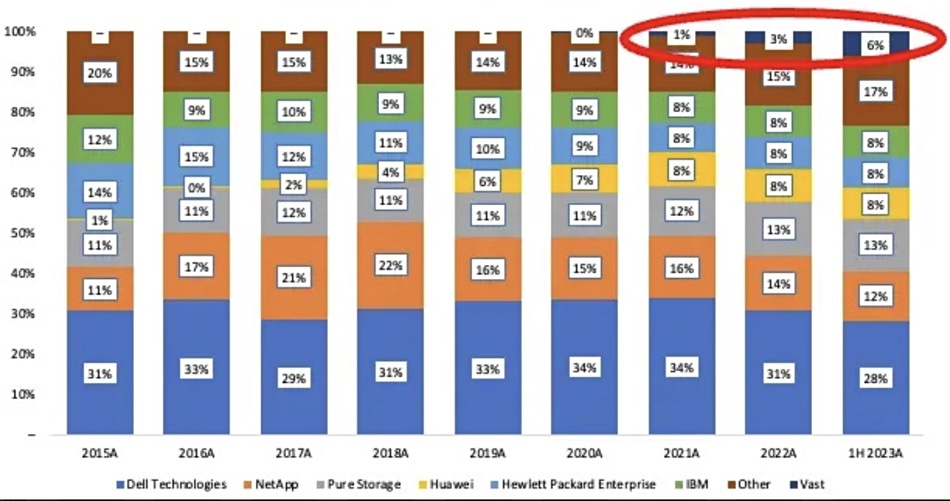
This is an equivalent to each supplier’s all-flash array market share and the basis for Flaningam’s storage market share chart. We turned Zeoli’s stacked bars into a line chart to show this;
Zeoli says that VAST has a business profile that “excels in cash flow and Annual Recurring Revenue (ARR), though may lag in live revenue.”
IDC Rebuttal
An IDC spokesperson said:”Both the stacked bar chart that Zeoli created and the line graph that Flaningam created (both of which appear in your story) are inaccurate. Our analysts could not figure out how Zeoli arrived at the figures presented in his original graphic (and the analysts assured me that these figures do not align to our All Flash Array market shares for 1H23). Our thinking is that the errors are due to the complete lack of a definition of what Zeoli means by “Data Center Flash Storage”. For the record, IDC does not currently track such a market, so those figures were created solely by Mr. Zeoli.”
A second point: “Another thing that raised our eyebrows is why anyone would include a software platform provider like VAST in a comparison of storage infrastructure (hardware) providers.”
And thirdly: “So, as you might guess, IDC cannot verify any of the data that appears in these graphics – the figures are all based on Mr. Zeoli’s “analysis”. But I think your article makes that fairly clear. And you did state that the charts were “based on” or “used” IDC data, which should imply to the reader that these are not a straight reading of IDC’s data. Unfortunately, not everyone caught that subtlety, but we thank you for that.”
As IDC was, apparently the source for Zeoli’s analysis, which itself was the basis for Flanagan’s subsequent article, then both are wrong. And that means that our reasoning that VAST’s ‘market share’ of 6 percent equates to slightly less than Pure’s 13 percent and hence its H1 2023 revenues were $673 million is also wrong. We cannot conclude that VAST has a 6 percent share of the data center all-flash array. market. Zeoli and Flaningam’s views are based on an inaccurate view of IDC numbers and our original version of this article was wrong as well.


