


Backblaze has published its quarterly disk drive reliability stats and explained how buying less reliable drives can be cheaper in the long run.
There is little change from last quarter’s report: the average annualized failure rate (AFR) in the quarterly table was 1.64 percent measured across 226,697 drives, with the worst performers being Seagate’s 4TB (4.38 percent), 12TB (4.96 percent), and 14TB (9.2 percent) models. A Toshiba 4TB drive had an 8.25 percent AFR, but Andy Klein, Backblaze principal cloud story teller, pointed out: “The high AFR (8.25 percent) is due to the limited number of drive days in the quarter (8,849) from only 95 drives.”
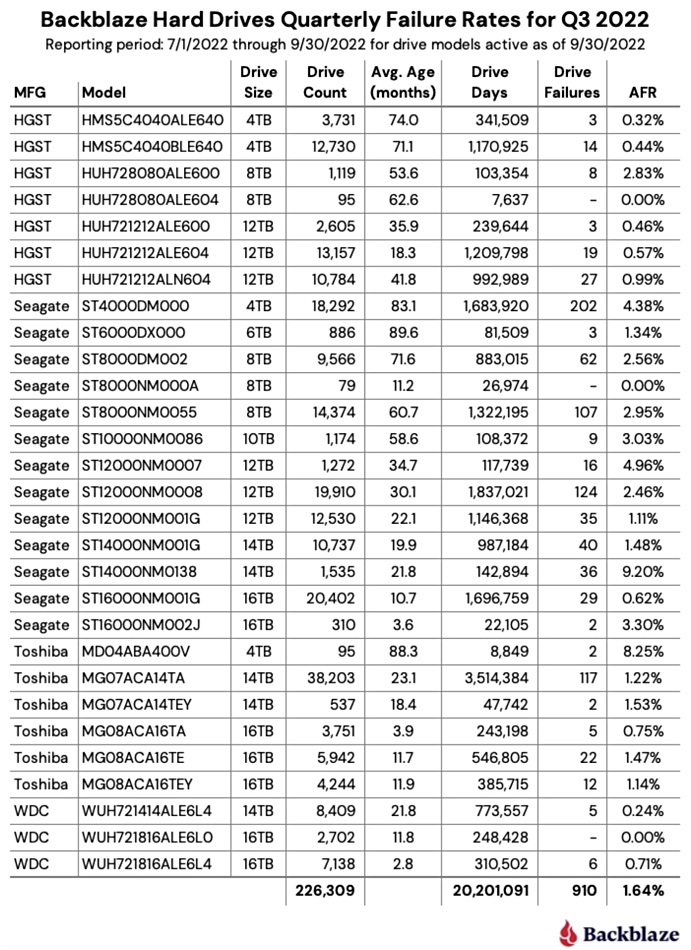
“Three drives had zero failures this quarter: the 8TB HGST (model: HUH728080ALE604), the 8TB Seagate (model: ST8000NM000A), and the 16TB WDC (model: WUH721816ALE6L0). For the 8TB HGST, that was the second quarter in a row with zero failures. Of the three, only the WDC model has enough lifetime data (drive days) to be comfortable with the calculated annualized failure rate (AFR).”
The Backblaze drive fleet is getting older. Klein noted: “The AFR for Q3 2022 was 1.64 percent, increasing from 1.46 percent in Q2 2022 and from 1.10 percent a year ago. As noted previously, this is related to the aging of the entire drive fleet and we would expect this number to go down as older drives are retired and replaced over the next year.”
In terms of lifetime stats, a couple of Seagate drives have greater than 3 percent annual failure rates; a 16TB one with a 3.3 percent AFR and a 14TB one failed more often with a 5.47 percent AFR. The average quarterly AFR was 1.41 percent across 226,000 drives.
Buying less reliable HDDs
Having accumulated all this data over many quarters, Klein posed the question: “Why would we continue to buy a drive model that has a higher annualized failure rate versus a comparably sized, but more expensive, model?” The answer comes from studying the relationship between acquisition costs and drive failure rates.
He supplies a theoretical table showing the acquisition costs, annual replacement costs, and failure rates for three 14TB hard disk drives to answer his question:
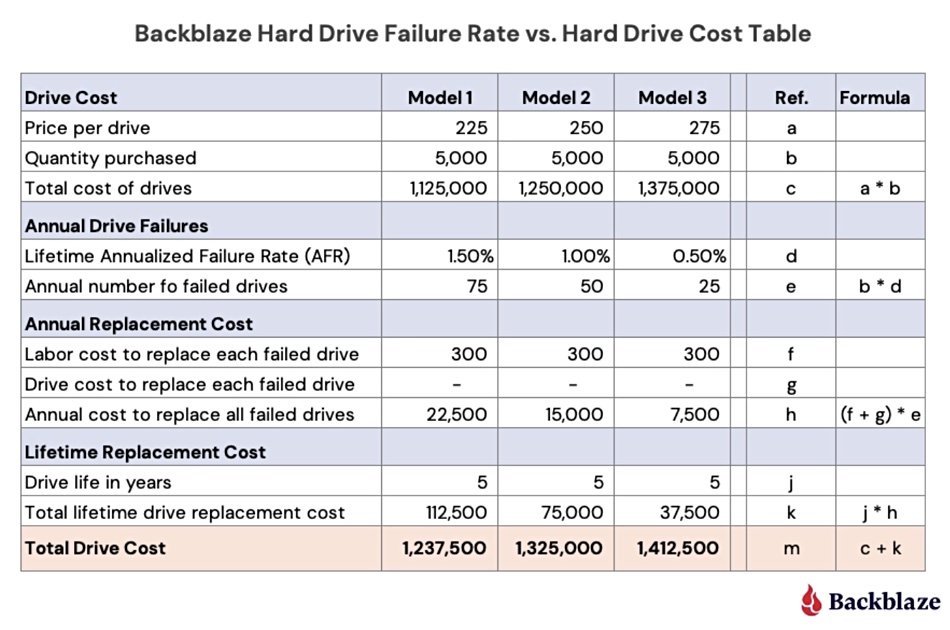
The three drives are priced as low, medium, and high with AFR values of 1.5, 1, and 0.5 percent respectively. They share the same replacement labor cost, $300. There is no drive replacement cost as “all drives are returned for credit or replacement to the manufacturer or their agent.”
The table lists the total cost of the drives over five years, factoring in the total lifetime drive replacement cost, which is added to the total cost of each drive model.
Even though, with the low-end model, more drives fail and the total drive replacement cost is higher than for the middle and top-end models, the acquisition cost is low enough for the total drive cost to be lowest of the three. The last line in the table shows this comparison.
Klein then asked: “How much failure can we tolerate before our original purchase decision is wrong?” Using the values in the table he computes that:
- Model 1 and Model 2 have the same total drive cost ($1,325,000) when the annualized failure rate for Model 1 is 2.67 percent
- Model 1 and Model 3 have the same total drive cost ($1,412,500) when the annualized failure rate for Model 1 is 3.83 percent.
He said that modeling drive costs and failure rates this way is important when buying thousands of drives a year: “The need for such a model is important in our business if you are interested in optimizing the efficiency of your cloud storage platform. Otherwise, just robotically buying the most expensive, or least expensive, drives is turning a blind eye to the expense side of the ledger.”


