


Analysis. Comparing the performance of storage products is bedevilled by the lack of benchmark testing for the three main storage storage access methods; blocks, files and objects. There are industry standard benchmarks but few suppliers use them and comparing results when a benchmark has five or more aspects can be tremendously difficult.
Blocks & Files recently explored this topic when comparing Nvidia DGX A100 GPU server storage vendors and found it a complete pain. There was no straightforward way to compare the storage vendors because they – and Nvidia – tested different storage configurations with varying hardware characteristics and varying GPU server target configurations.
We tried generating a single storage node to single DGX A-100 throughput measure across the suppliers. This ran into the problem of defining a storage node. Is a NetApp A-800 high-availability pair ‘node’ equivalent to a Pavilion HyperParallel array ’node’ and are they equivalent to a VAST Data Universal Storage array or a WekaIO cluster all of equivalent capacity?
Their physical size and performance vary widely.
Normalising factor
We decided it was obvious that there was no single normalising factor; not throughput, not IOPS, not rack units and not product SKU. Instead we realised that we needed a base factor to which other things could be related. This base factor had to be common across products and represent something that was relevant to enterprise customers.
What ever storage product they have, be it software sold on its own or a HW+SW combination, has to fit in a standard rack and deliver data to accessing systems in block, file or object format, or some combination of those
Rack unit normalisation
We realised that rack units could be our base normalising factor.
Whatever storage product is used it fits in a rack and its performance on any basic protocol; block file or object, can be expressed in units per rack unit or U for short.
For example, let’s envisage a HW+SW filer. It could be a 5U filer delivering 750,000 read or write IOPS, 50MB/sec read bandwidth, 35MB/sec write bandwidth, and costing $350,000. These IOPS, bandwidth and cost numbers can be divided by 5 to produce IOPS/U, read and write MB/U and cost/U. The resulting numbers are 150,000 read/write IOPS, 10MB/sec read, 7MB/sec write and $70,000.
This normalised-to-U approach provides a basis for comparing the 5U HW+SW filer with a SW-only file system product like WekaIO or VAST Data’s Universal Storage platform.
Envisaging numbers
The WekaIO system runs in server cluster nodes. Let’s envisage an imaginary 3-server WekaIO config using three 2U servers which outputs 1 million read or write IOPS, 75MB/sec read, 50MB/sec write and an overall cost of $400,000. We divide these numbers by 6 to derive per-U numbers, such as 166,666 read/write IOPS, 12.5MB/sec read and 8.3MB/sec write bandwidth, and $66,667.
Immediately we can compare the 5Y HW+SW filer with the WekaIO system and see the WekaIO system is cheaper; $66.667/U vs $70,000/U. Similarly it has better read/write IOPS and read and write bandwidth than the 5U filer in our fantasy comparison.
All these numbers are made up and exist only to illustrate the approach. You use the attributes that are valid to you, such as subscription cost over three years instead of acquisition cost plus three years support. And then you compare various candidate products and normalise their values on these attributes to per-U numbers.
Worked example
We decided to try a worked example and looked at block storage and started building a spreadsheet using whatever publicly available supplier numbers we could find;
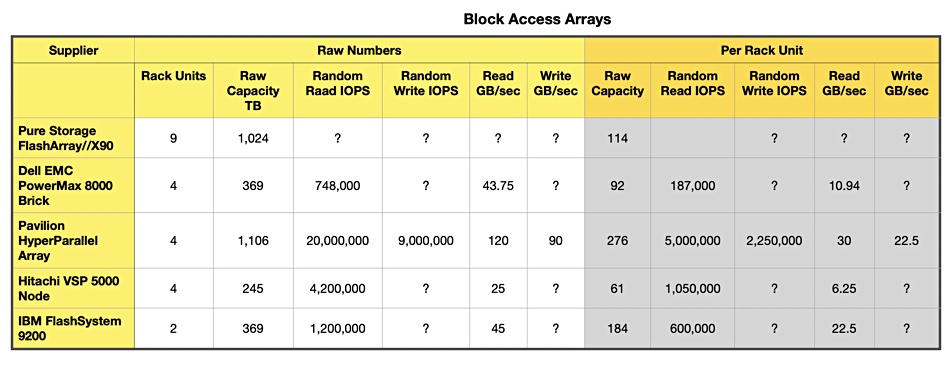
The product numbers are on the left side of the table with the per-rack unit numbers in the grey stippled area to the right. There are a fair few missing numbers, as not all array suppliers publicly reveal their performance numbers.
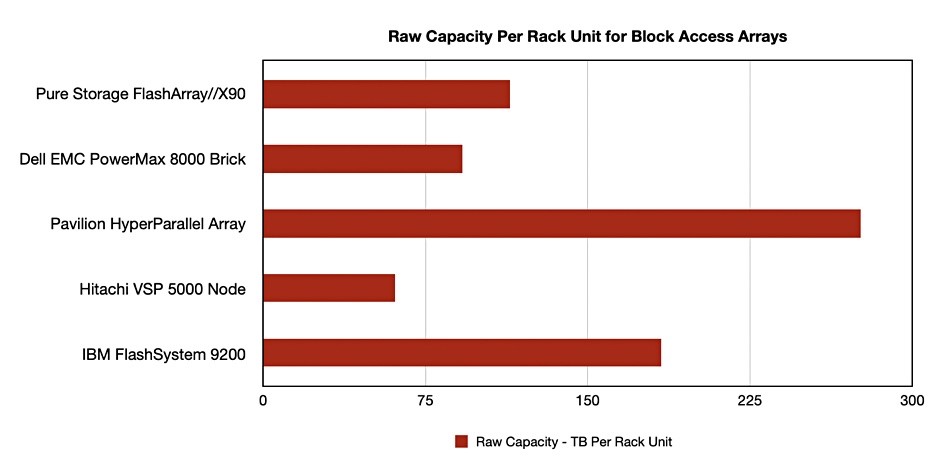
We can chart columns of interest to make supplier comparisons easier. For example, raw capacity per rack unit:
We recognised that our spreadsheet could have cost and latency numbers added but also saw that supplier data sheets miss out many numbers, such as random write IOPS, random read and write latencies, cost and so forth.
If customers were to use this approach of normalising product attributes to rack units they could ask their candidate vendors for these numbers.
Conclusion
This normalisation to rack unit approach seems to provide a valid way to compare multiple different suppliers’ products on basic performance and cost attributes, with a couple of caveats:
- Performance tests should be run with multiple clients to fully saturate the hardware/software system.
- The same client and network configuration should be used for each supplier product test.
It’s applicable to on-premises block, file and object storage systems, be they external shared storage, software-defined storage or hyper-converged systems. It could not be used to compare public cloud storage offerings though. That would need a different approach, one that our brain cells cannot yet work out.


