Gartner number crunching shows Dell EMC is building a substantial all-flash array (AFA) revenue lead over NetApp. NetApp remains in second place in this market but Huawei and Pure Storage are catching up fast.
Wells Fargo senior analyst Aaron Rakers told his subscribers: “Gartner estimates that NetApp exited 2020 with a ~16 per cent all-Flash systems revenue share, following Dell EMC at 27 per cent and ahead of PureStorage and IBM both at estimated ~12 per cent revenue share positions. Gartner estimates that NetApp’s all-Flash FAS arrays account for over 90 per cent of NetApp’s total all-Flash systems revenue in calendar 2020; accounting for over 55 per cent of NetApp’s total systems revenue.”
He added: “Gartner estimates that the AFA market accounted for ~55 per cent of total primary storage industry revenue in 2020, or ~$8.82 billion, -5 per cent y/y. However, all-Flash capacity shipped accounted for approximately 12 per cent of total external storage capacity shipped.”
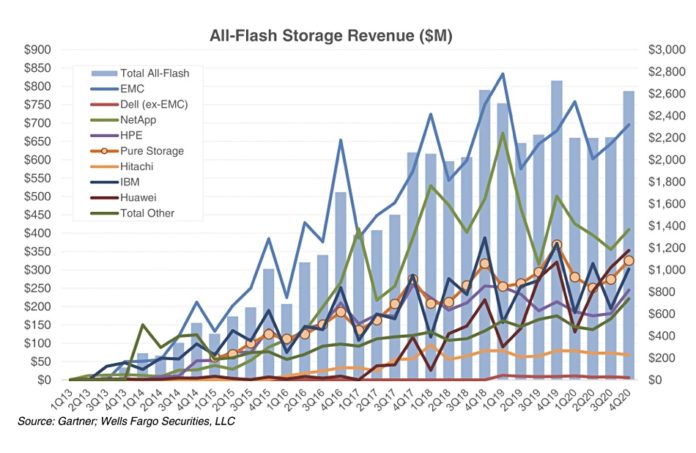
Rakers has charted supplier AFA revenues since the first 2013 quarter, showing how their growth rates have differed:
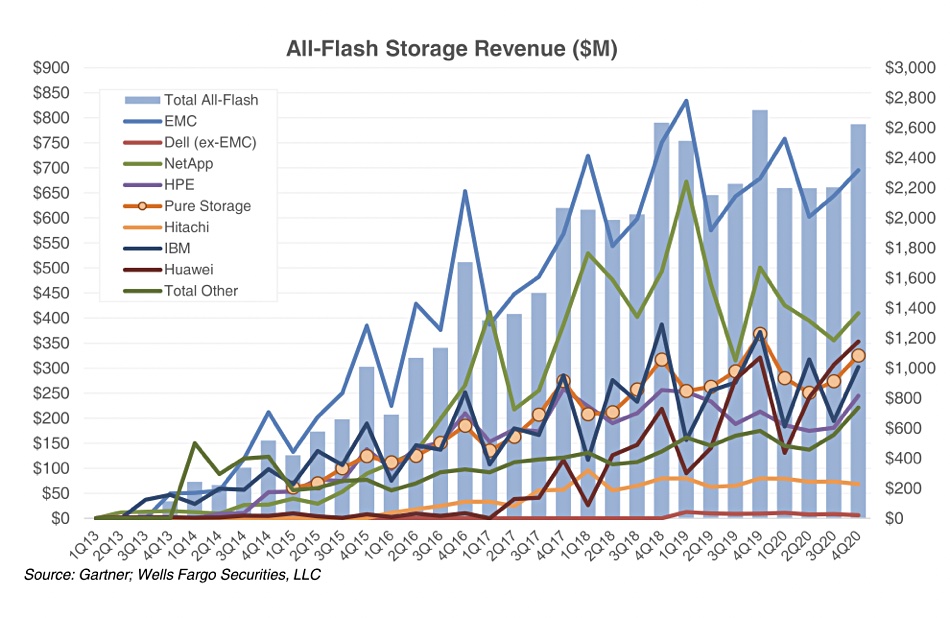
This chart, which uses calendar years, shows NetApp breaking away from a group of similar revenue-earning suppliers in the 1Q17 to 3Q17 period and catching up with leader Dell EMC. It actually beat Dell EMC AFA revenues in 1Q17. However, momentum was not sustained and NetApp began drifting back to the chasing pack from 1Q19 onwards.
In 4Q17 IBM, HPE and Pure were level pegging with $250m-300m in AFA revenue, while Huawei was down at the $100m level. NetApp was in the $350m – $400m area, and Dell EMC led with $550m-plus revenue. Three years later, in 4Q20, HPE was still at the $250m level, IBM has grown slightly to just above $300m, Pure is around $325m and Huawei has soared to $350m-ish. NetApp has grown to the $400m point, while Dell EMC still leads but at a higher level, nudging $700m.
In general, it seems that HPE has not done as good a job as Dell EMC, IBM and NetApp in selling to the installed customer base or gaining new customers – which is what Pure has had to do. Hitachi has done even less well than HPE.
A pie chart shows supplier AFA revenue market shares;
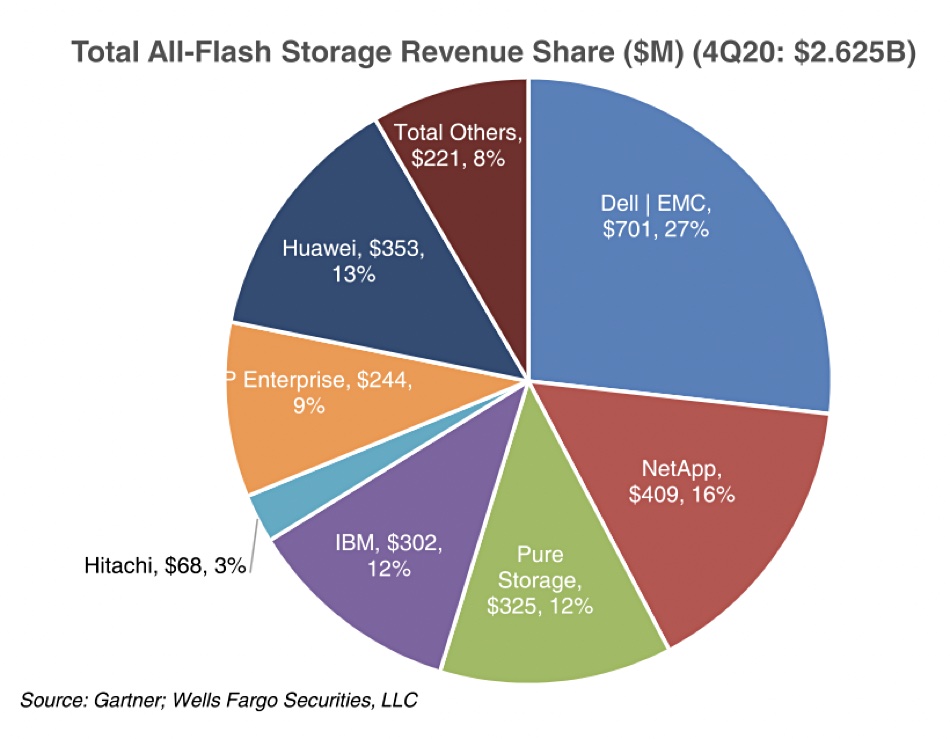
HPE ranked fifth in Q4 2020 with nine per cent, behind Pure and IBM, in joint fourth place with a 12 per cent share each, Huawei at 13 per cent, NetApp at 16 per cent, and Dell EMC at 27 per cent. Hitachi is a long way behind, on three per cent.
Rakers has separately tracked NatApp AFA and Pure Storage revenues and compared them.
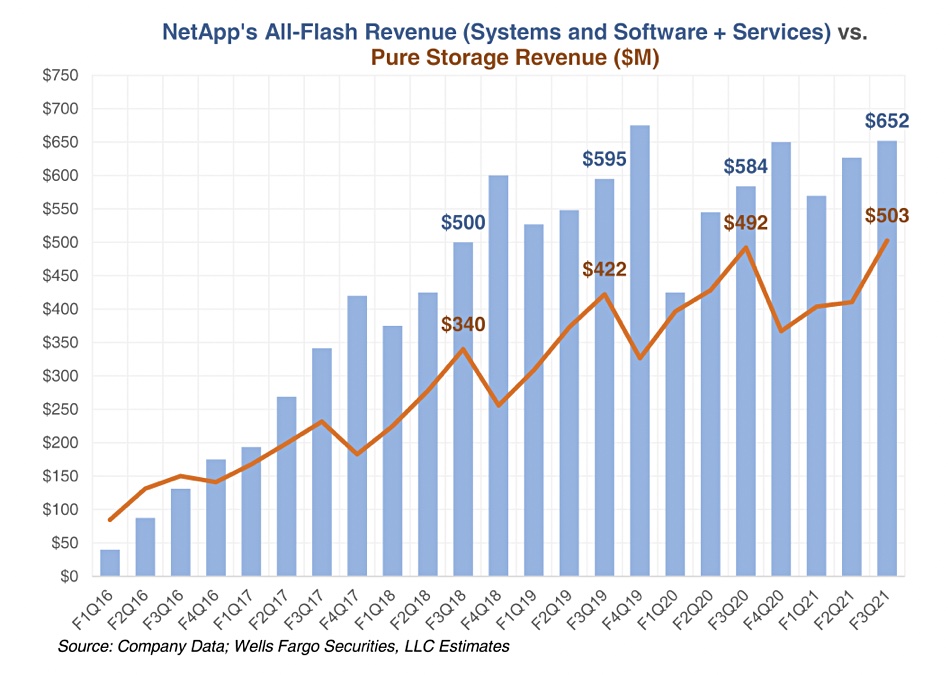
The curves on the chart show quite evident seasonality with end-of-year peaks and, apart from F1Q20, no sustained evidence over multiple quarters that Pure’s revenues are catching up with NetApp’s, or that NetApp is drawing ahead of Pure.
This is despite NetApp having no equivalent product to Pure’s file+object FlashBlade which pulls in around $50m a quarter. NetApp’s all-flash SGF6024 StorageGRID is positioned primarily as high-performance object store with NAS access layered on top. If the company also positioned the system as a fast-restoring and unified file-object engine, it could perhaps dent FlashBlade’s sales momentum.


