


ScaleFlux’s computational storage drives have slightly better and much less variable multi-threaded performance on a PostgreSQL database application than ordinary SSDs. They also use up substantially less drive capacity than a vanilla SSD because of their integrated compression.
These are the findings of Percona, a database testing firm, which has published its evaluations in a white paper.
ScaleFlux CSD 2000 drives are SSDs with an integrated FPGA processing and compression engine that operate directly on the data stored in the drive. ScaleFlux contracted Percona to test a 4TB CSD 200 against a 3.2TB Intel DC P6410 64-layer TLC SSD with PostgreSQL.
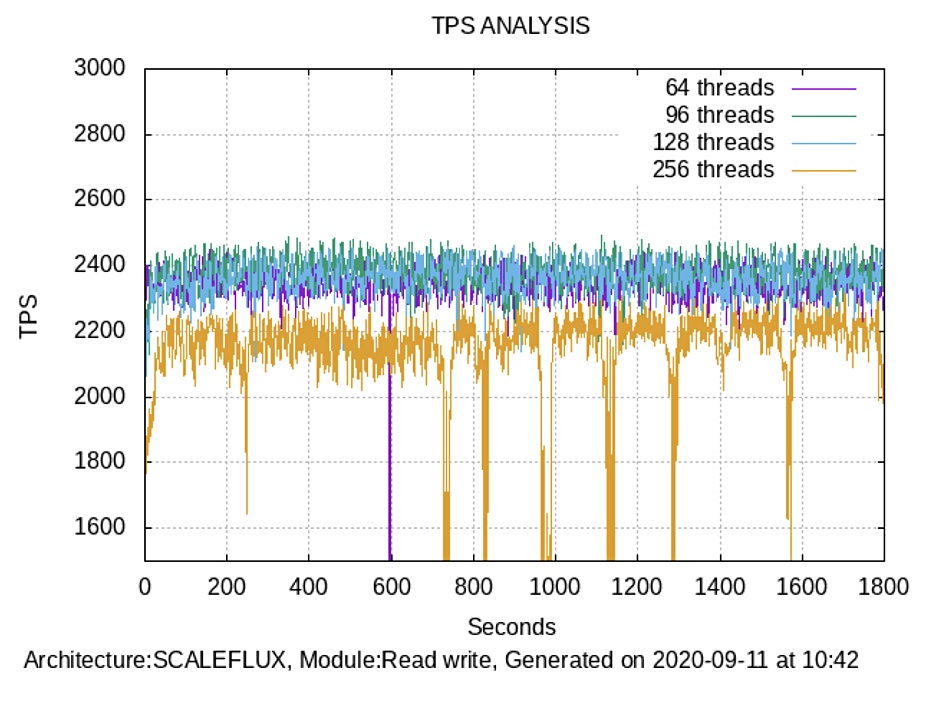
Robert Bernier, Percona’s PostgreSQL consultant, wrote: “At peak loading, the ScaleFlux CSD 2000 Drive demonstrated less performance variance than that of the Intel DC P4610,” over time.
The significance here is “server predictability. This becomes important when, for example, finely tuned application processes depend upon consistent performance with the RDBMS,” Bernier wrote. “Many a time I’ve seen applications get upset when response times between inserting, updating, or deleting data and getting the resultant queries would suddenly change.”
he also noted “remarkable” space savings when the Postgres fillfactor was reduced.
The fillfactor for a table is a percentage that determines how full the index method packs the index pages. Percona tested the. CSD 2000 drive with fill factors of 70 and 100 per cent and a variety of threads: 1, 8, 16, 32, 64, 96, 128 and 256. The company measured transactions per second (TPS) and queries per second (QPS) scores read-only, write-only and mixed read/write operations for each test run.
According to Bernier, fillfactor can “become a critical runtime parameter in regards to performance when high-frequency UPDATE and DELETE operations take place on the same tuple over and over again.” A tuple is a database object containing two or more components.
Two read/write TPS charts illustrate the ScaleFlux drive’s greater performance consistency at high thread counts, compared to the vanilla SSD:
A table shows the ScaleFlux drive’s lower capacity take-up;:
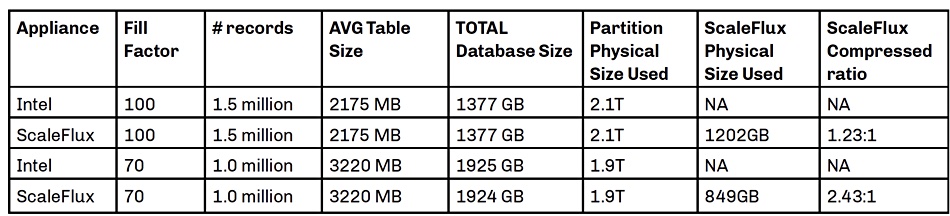
The rightmost column shows the ScaleFlux drive’s compression ratios; 1.23:1 with the 100 fillfactor and 2.43:1 at the 70 fillfactor level. On the Intel drive, using the default setting of fillfactor 100, the database consumed 918GB per 1 million records. The CSD 2000 consumed 718GB per 1M records at that level and dropped to 515GB per 1 million records at fillfactor 70.


