


Analyst and consultancy firm ESG has validated WekaIO’s scale-out, parallel file system performance in three benchmarks – SPEC SFS 2014, IO-500, and STAC-M3 – finding it generally goes a lot faster than competing systems. But Intel has actually trounced Weka on the IO-500 test.
B&F has seen an ESG document: “WekaFS: Storage for Modern Exascale Workloads in the Enterprise,” which describes ESG’s findings.
SPEC SFS 2014
There are five different SPEC SFS 2014 tests reflecting different application environments in which file storage is used: SW Builds, VDA (streaming data), EDA (Electronic Design Automation), VDI and Database (OLTP database consolidation). Not all vendors submit results in all five categories.
ESG looked at Weka’s performance in four of them, leaving out VDI, and comparing Weka to the next best result:
We have a B&F chart showing more suppliers’ scores in the five categories:
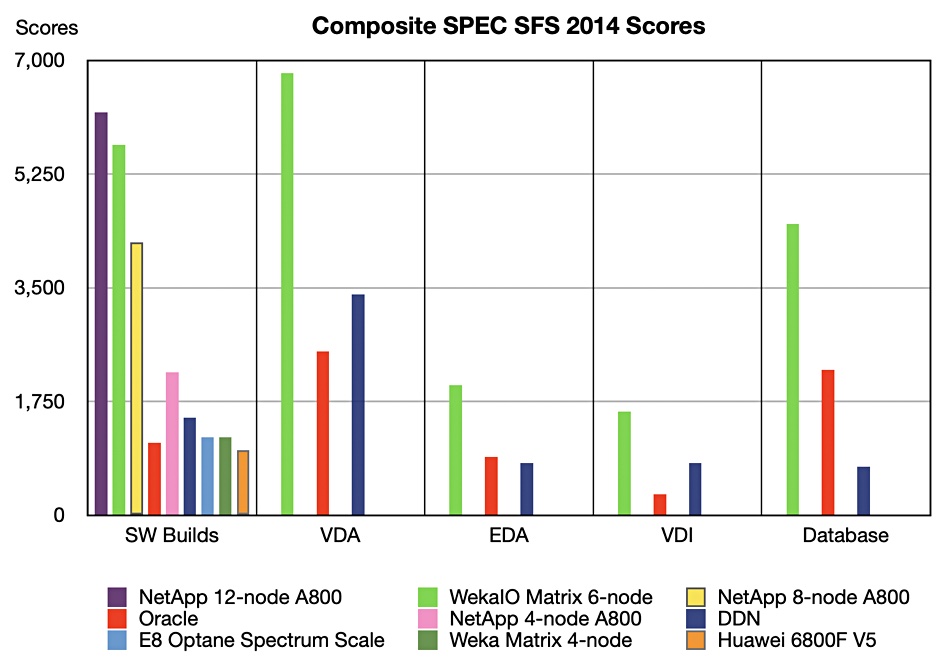
ESG said that, although NetApp scored higher than Weka in the SW Builds benchmark, 6,200 vs Weka’s 5,700, Weka produced its builds faster, having a 0.63ms average latency at 5,700 builds vs NetApp’s 2.8ms at 6,200 builds.
NetApp’s overall response time was 0.83ms while Weka’s was 0.26ms.
1O-500
The IO-500 benchmark computes a score using file data and metadata access tests for high-performance computing (HPC) systems. ESG said: “IO-500 scoring is derived from the square root of the product of metadata IOPS and throughput” and compared Weka’s result to three other systems:
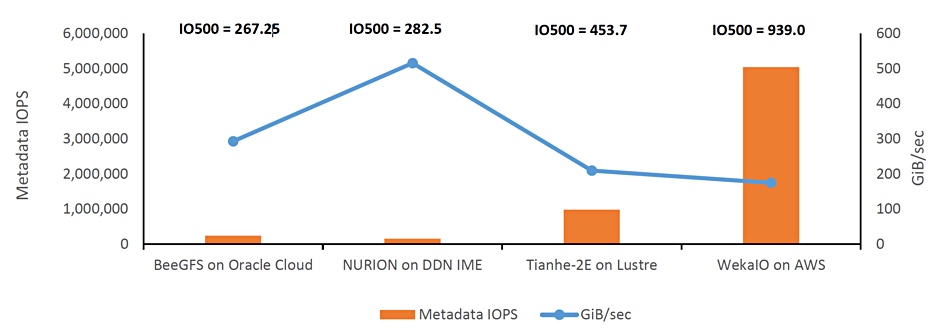
It declared: “Weka’s IO-500 results on AWS are significantly higher than other file system solutions whether on-premises or running in the cloud.”
Not so fast ESG. Intel scored higher still with an August 2020 result using its DAOS filesystem, 1,792.98 vs Weka’s 938.95 – nearly twice as fast. Intel’s score was helped by it using Optane SSDS and Optane Persistent Memory (DIMMs). Intel’s previous best IO-500 result was 933.64.
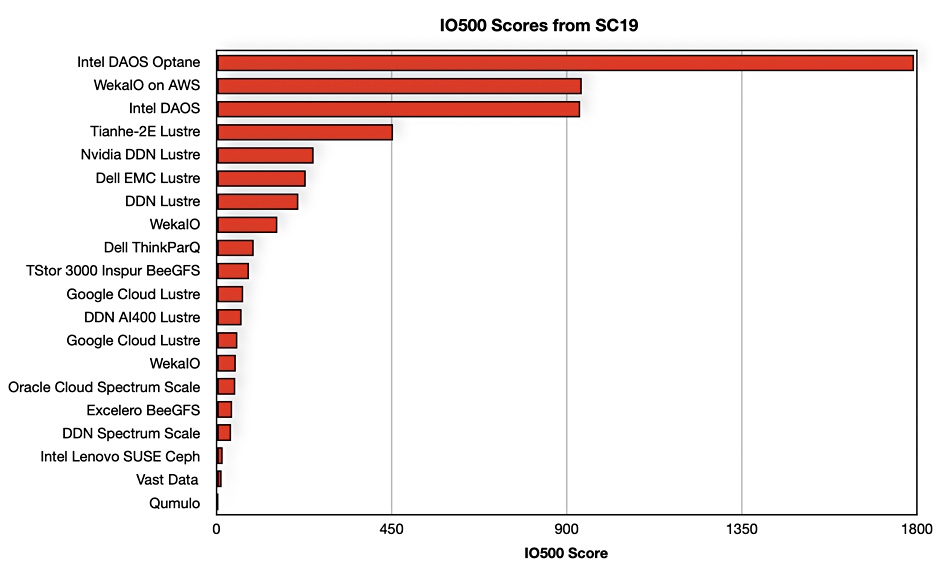
Weka is relying on parallelism for its IO-500 result; it used 345 client nodes. The Intel DAOS Optane score needed just 52 nodes. If Weka wants to get past this 1,792.98 IO-500 score it looks as if it will have to use Optane Persistent Memory and SSDs to do it.
STAC-M3
The third benchmark ESG looked at was the STAC-M3 suite, used in the financial services industry. The STAC acronym stands for the Securities Technology Analysis Center.
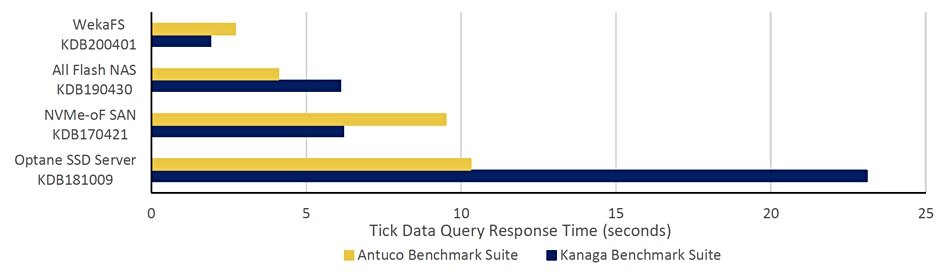
ESG deployed an an eight-node WekaFS cluster on the AWS public cloud using 8, 10, 12 and then 16 i3en.24xlarge all-flash instances. Throughput scaled linearly as nodes were added to the cluster.
The all-flash NAS in the chart was a Dell Isilon F800 with PowerEdge servers. The NVMe-oF San refers to a Vexata VX-100 all flash array with Intel 22-core Xeon E5-2699 servers. The Optane SSD server was a Lenovo ThinkSystem SR950 with 4 x Xeon Platinum 8180 CPUs and 6TB of Intel DC P4800X (Optane) SSD capacity bulked out with 56TB of Intel DC P4510 (3D NAND) SSDs.
The ESG document also looks at extending a file system with object storage where Weka gives a good account of itself. Expect Weka to publish the ESG document quite soon.


